
|
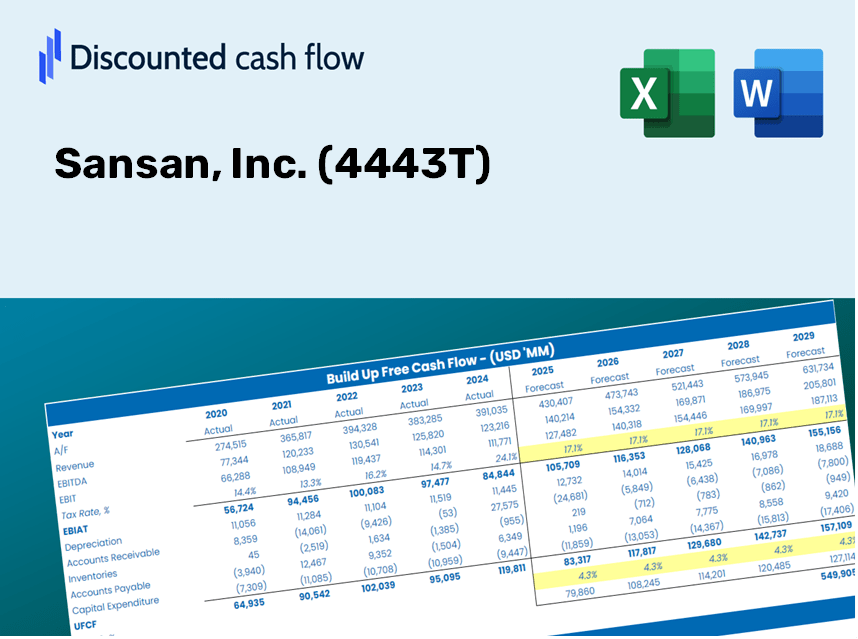
Sansan, Inc. (4443.T) Valoración de DCF |
Completamente Editable: Adáptelo A Sus Necesidades En Excel O Sheets
Diseño Profesional: Plantillas Confiables Y Estándares De La Industria
Predeterminadas Para Un Uso Rápido Y Eficiente
Compatible con MAC / PC, completamente desbloqueado
No Se Necesita Experiencia; Fáciles De Seguir
Sansan, Inc. (4443.T) Bundle
¡Explore las perspectivas financieras de Sansan, Inc. (4443T) con nuestra calculadora DCF fácil de usar! Ingrese sus proyecciones para el crecimiento, los márgenes y los gastos para determinar el valor intrínseco de Sansan, Inc. (4443T) y refinar su enfoque de inversión.
What You Will Receive
- Adjustable Forecast Parameters: Flexibly modify key assumptions (growth %, margins, WACC) to explore various scenarios.
- Real-World Insights: Pre-loaded financial data for Sansan, Inc. ([4443T]) to kickstart your analysis.
- Automated DCF Calculations: The template computes Net Present Value (NPV) and intrinsic value effortlessly.
- Tailored and Professional: A refined Excel model designed to meet your valuation requirements.
- Designed for Analysts and Investors: Perfect for evaluating projections, confirming strategies, and enhancing efficiency.
Key Features
- Comprehensive Data: Access Sansan, Inc.'s historical financial reports and pre-configured projections.
- Customizable Parameters: Modify WACC, tax percentages, revenue growth rates, and EBITDA margins.
- Real-Time Insights: Watch the intrinsic value of Sansan, Inc. () update instantly.
- Intuitive Visuals: Dashboard graphs present valuation outcomes and essential metrics clearly.
- Designed for Precision: A professional-grade resource for analysts, investors, and finance professionals.
How It Works
- 1. Access the Template: Download and open the Excel file containing Sansan, Inc. (4443T)'s preloaded data.
- 2. Adjust Assumptions: Modify key parameters such as growth rates, WACC, and capital expenditures.
- 3. View Results Instantly: The DCF model automatically computes the intrinsic value and NPV.
- 4. Explore Scenarios: Evaluate multiple forecasts to investigate various valuation outcomes.
- 5. Present with Confidence: Share professional valuation insights to back your decision-making.
Why Choose This Calculator for Sansan, Inc. (4443T)?
- Designed for Industry Experts: A sophisticated tool utilized by analysts, finance officers, and consultants.
- Accurate Financial Data: Sansan’s historical and projected financial figures are included for precise analysis.
- Flexible Scenario Analysis: Effortlessly test various forecasts and assumptions.
- Insightful Results: Calculates intrinsic value, NPV, and essential metrics automatically.
- User-Friendly Interface: Comprehensive, step-by-step guidance helps you navigate the tool.
Who Can Benefit from This Product?
- Individual Investors: Make well-informed decisions surrounding the purchase or sale of Sansan, Inc. (4443T) stock.
- Financial Analysts: Optimize valuation workflows with ready-to-use financial models tailored for Sansan, Inc. (4443T).
- Consultants: Provide clients with expert valuation insights for Sansan, Inc. (4443T) quickly and effectively.
- Business Owners: Gain insights into how companies like Sansan, Inc. (4443T) are valued to inform your business strategy.
- Finance Students: Explore valuation techniques using real-world data and scenarios relevant to Sansan, Inc. (4443T).
Contents of the Template
- Preloaded SNXS Data: Historical and projected financial information, including revenue, EBIT, and capital expenditures.
- DCF and WACC Models: Professional-grade templates for determining intrinsic value and Weighted Average Cost of Capital.
- Editable Inputs: Yellow-highlighted cells for customizing revenue growth, tax rates, and discount rates.
- Financial Statements: Detailed annual and quarterly financial reports for in-depth analysis.
- Key Ratios: Metrics for profitability, leverage, and efficiency to assess company performance.
- Dashboard and Charts: Visual representations of valuation outcomes and underlying assumptions.
Disclaimer
All information, articles, and product details provided on this website are for general informational and educational purposes only. We do not claim any ownership over, nor do we intend to infringe upon, any trademarks, copyrights, logos, brand names, or other intellectual property mentioned or depicted on this site. Such intellectual property remains the property of its respective owners, and any references here are made solely for identification or informational purposes, without implying any affiliation, endorsement, or partnership.
We make no representations or warranties, express or implied, regarding the accuracy, completeness, or suitability of any content or products presented. Nothing on this website should be construed as legal, tax, investment, financial, medical, or other professional advice. In addition, no part of this site—including articles or product references—constitutes a solicitation, recommendation, endorsement, advertisement, or offer to buy or sell any securities, franchises, or other financial instruments, particularly in jurisdictions where such activity would be unlawful.
All content is of a general nature and may not address the specific circumstances of any individual or entity. It is not a substitute for professional advice or services. Any actions you take based on the information provided here are strictly at your own risk. You accept full responsibility for any decisions or outcomes arising from your use of this website and agree to release us from any liability in connection with your use of, or reliance upon, the content or products found herein.