
|
Otsuka Holdings Co., Ltd. (4578.T) Valoración de DCF |
Completamente Editable: Adáptelo A Sus Necesidades En Excel O Sheets
Diseño Profesional: Plantillas Confiables Y Estándares De La Industria
Predeterminadas Para Un Uso Rápido Y Eficiente
Compatible con MAC / PC, completamente desbloqueado
No Se Necesita Experiencia; Fáciles De Seguir
Otsuka Holdings Co., Ltd. (4578.T) Bundle
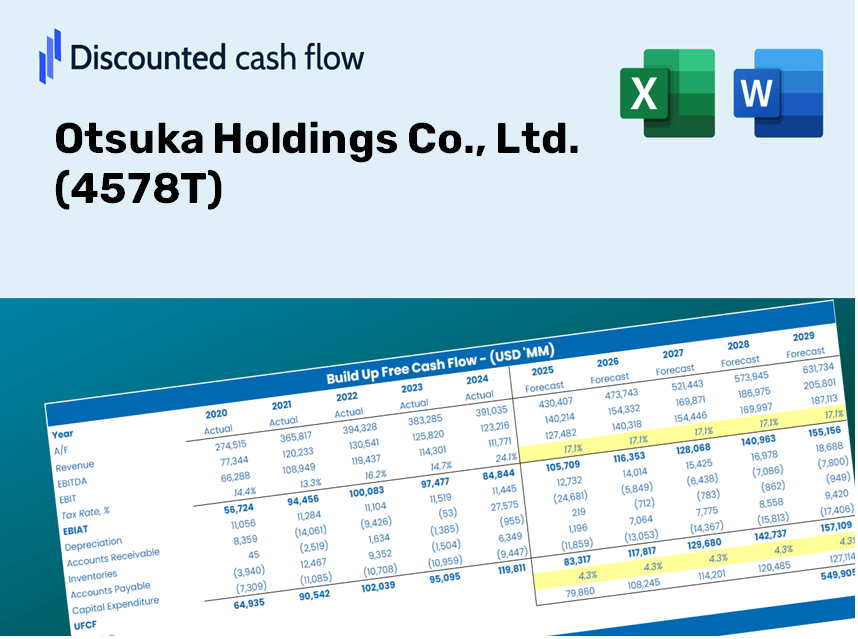
¡Mejore su estrategia de inversión con la calculadora DCF de Otsuka Holdings Co., Ltd. (4578T)! Analice datos financieros reales, ajuste las predicciones y gastos de crecimiento, y observe cómo estas modificaciones afectan el valor intrínseco de Otsuka Holdings Co., Ltd. (4578T) en tiempo real.
Discounted Cash Flow (DCF) - (USD MM)
| Year | AY1 2020 |
AY2 2021 |
AY3 2022 |
AY4 2023 |
AY5 2024 |
FY1 2025 |
FY2 2026 |
FY3 2027 |
FY4 2028 |
FY5 2029 |
|---|---|---|---|---|---|---|---|---|---|---|
| Revenue | 1,422,826.0 | 1,498,276.0 | 1,737,998.0 | 2,018,568.0 | 2,329,861.0 | 2,452,350.4 | 2,581,279.6 | 2,716,987.0 | 2,859,829.0 | 3,010,180.8 |
| Revenue Growth, % | 0 | 5.3 | 16 | 16.14 | 15.42 | 5.26 | 5.26 | 5.26 | 5.26 | 5.26 |
| EBITDA | 273,371.0 | 244,254.0 | 266,925.0 | 224,199.0 | 452,621.0 | 399,279.7 | 420,271.3 | 442,366.5 | 465,623.4 | 490,102.9 |
| EBITDA, % | 19.21 | 16.3 | 15.36 | 11.11 | 19.43 | 16.28 | 16.28 | 16.28 | 16.28 | 16.28 |
| Depreciation | 79,423.0 | 84,855.0 | 93,761.0 | 97,777.0 | 107,979.0 | 128,104.8 | 134,839.8 | 141,928.8 | 149,390.5 | 157,244.5 |
| Depreciation, % | 5.58 | 5.66 | 5.39 | 4.84 | 4.63 | 5.22 | 5.22 | 5.22 | 5.22 | 5.22 |
| EBIT | 193,948.0 | 159,399.0 | 173,164.0 | 126,422.0 | 344,642.0 | 271,174.9 | 285,431.5 | 300,437.7 | 316,232.8 | 332,858.4 |
| EBIT, % | 13.63 | 10.64 | 9.96 | 6.26 | 14.79 | 11.06 | 11.06 | 11.06 | 11.06 | 11.06 |
| Total Cash | 356,851.0 | 410,684.0 | 471,634.0 | 513,341.0 | 426,173.0 | 604,996.0 | 636,802.8 | 670,281.9 | 705,521.1 | 742,613.0 |
| Total Cash, percent | .0 | .0 | .0 | .0 | .0 | .0 | .0 | .0 | .0 | .0 |
| Account Receivables | 379,107.0 | 380,191.0 | 426,381.0 | 474,086.0 | 515,289.0 | 599,137.4 | 630,636.2 | 663,791.1 | 698,689.1 | 735,421.8 |
| Account Receivables, % | 26.64 | 25.38 | 24.53 | 23.49 | 22.12 | 24.43 | 24.43 | 24.43 | 24.43 | 24.43 |
| Inventories | 173,827.0 | 180,350.0 | 223,507.0 | 249,581.0 | 298,292.0 | 305,472.0 | 321,531.8 | 338,435.9 | 356,228.7 | 374,957.0 |
| Inventories, % | 12.22 | 12.04 | 12.86 | 12.36 | 12.8 | 12.46 | 12.46 | 12.46 | 12.46 | 12.46 |
| Accounts Payable | 93,216.0 | 93,923.0 | 104,071.0 | 206,369.0 | 219,996.0 | 188,704.3 | 198,625.2 | 209,067.7 | 220,059.1 | 231,628.4 |
| Accounts Payable, % | 6.55 | 6.27 | 5.99 | 10.22 | 9.44 | 7.69 | 7.69 | 7.69 | 7.69 | 7.69 |
| Capital Expenditure | -97,875.0 | -113,152.0 | -107,787.0 | -114,673.0 | -129,362.0 | -156,293.7 | -164,510.7 | -173,159.6 | -182,263.3 | -191,845.5 |
| Capital Expenditure, % | -6.88 | -7.55 | -6.2 | -5.68 | -5.55 | -6.37 | -6.37 | -6.37 | -6.37 | -6.37 |
| Tax Rate, % | -2.16 | -2.16 | -2.16 | -2.16 | -2.16 | -2.16 | -2.16 | -2.16 | -2.16 | -2.16 |
| EBITAT | 151,224.7 | 122,212.9 | 134,068.6 | 107,777.1 | 352,098.1 | 226,332.1 | 238,231.2 | 250,755.9 | 263,939.0 | 277,815.3 |
| Depreciation | ||||||||||
| Changes in Account Receivables | ||||||||||
| Changes in Inventories | ||||||||||
| Changes in Accounts Payable | ||||||||||
| Capital Expenditure | ||||||||||
| UFCF | -326,945.3 | 87,015.9 | 40,843.6 | 119,400.1 | 254,428.1 | 75,823.1 | 170,922.5 | 179,908.5 | 189,367.0 | 199,322.7 |
| WACC, % | 4.61 | 4.61 | 4.61 | 4.63 | 4.65 | 4.62 | 4.62 | 4.62 | 4.62 | 4.62 |
| PV UFCF | ||||||||||
| SUM PV UFCF | 702,786.5 | |||||||||
| Long Term Growth Rate, % | 3.00 | |||||||||
| Free cash flow (T + 1) | 205,302 | |||||||||
| Terminal Value | 12,651,617 | |||||||||
| Present Terminal Value | 10,092,892 | |||||||||
| Enterprise Value | 10,795,679 | |||||||||
| Net Debt | -236,790 | |||||||||
| Equity Value | 11,032,469 | |||||||||
| Diluted Shares Outstanding, MM | 541 | |||||||||
| Equity Value Per Share | 20,377.52 |
What You Will Receive
- Authentic Otsuka Data: Comprehensive financials – including revenue and EBIT – derived from actual and forecasted figures.
- Complete Customization: Modify all essential parameters (yellow cells) such as WACC, growth %, and tax rates.
- Immediate Valuation Adjustments: Automatic recalculations to assess the effect of changes on Otsuka’s fair value.
- Flexible Excel Template: Designed for quick modifications, scenario analyses, and detailed forecasts.
- Efficient and Precise: Bypass the need to build models from scratch while ensuring accuracy and adaptability.
Key Features
- 🔍 Real-Life Otsuka Financials: Pre-filled historical and projected data for Otsuka Holdings Co., Ltd. (4578T).
- ✏️ Fully Customizable Inputs: Adjust all critical parameters (yellow cells) such as WACC, growth %, and tax rates.
- 📊 Professional DCF Valuation: Built-in formulas calculate Otsuka’s intrinsic value using the Discounted Cash Flow method.
- ⚡ Instant Results: Visualize Otsuka’s valuation immediately after making adjustments.
- Scenario Analysis: Test and compare the outcomes of various financial assumptions side-by-side.
How It Functions
- 1. Access the Template: Download and open the Excel file featuring Otsuka Holdings Co., Ltd.'s (4578T) preloaded data.
- 2. Modify Assumptions: Adjust key parameters such as growth rates, WACC, and capital expenditures.
- 3. Get Instant Results: The DCF model automatically calculates the intrinsic value and NPV.
- 4. Explore Scenarios: Analyze various forecasts to evaluate different valuation results.
- 5. Present with Assurance: Provide expert valuation insights to back your decision-making process.
Why Choose Otsuka Holdings Co., Ltd. (4578T)?
- Time-Efficient: Skip the hassle of building a financial model from the ground up – our resources are readily accessible.
- Enhanced Accuracy: Utilize dependable financial insights and methodologies to minimize valuation discrepancies.
- Completely Customizable: Adjust the model to align with your unique forecasts and assumptions.
- Simple to Analyze: User-friendly charts and outputs facilitate straightforward interpretation of results.
- Endorsed by Professionals: Crafted for experts who prioritize accuracy and ease of use.
Who Can Benefit from This Product?
- Professional Investors: Develop comprehensive and trustworthy valuation models for portfolio evaluation of Otsuka Holdings Co., Ltd. (4578T).
- Corporate Finance Teams: Assess various valuation scenarios to inform strategic decisions within the organization.
- Consultants and Advisors: Deliver precise valuation insights related to Otsuka Holdings Co., Ltd. (4578T) for client consultations.
- Students and Educators: Utilize real-world data to enhance learning and practice in financial modeling.
- Healthcare Enthusiasts: Gain a deeper understanding of how companies like Otsuka Holdings Co., Ltd. (4578T) are valued in the healthcare market.
Contents of the Template
- Pre-Filled DCF Model: Otsuka Holdings' financial data preloaded for immediate access.
- WACC Calculator: Comprehensive calculations for Weighted Average Cost of Capital.
- Financial Ratios: Analyze Otsuka's profitability, leverage, and operational efficiency.
- Editable Inputs: Adjust assumptions such as growth rates, profit margins, and CAPEX to suit your scenarios.
- Financial Statements: Annual and quarterly reports available for in-depth analysis.
- Interactive Dashboard: Effortlessly visualize essential valuation metrics and outcomes.
Disclaimer
All information, articles, and product details provided on this website are for general informational and educational purposes only. We do not claim any ownership over, nor do we intend to infringe upon, any trademarks, copyrights, logos, brand names, or other intellectual property mentioned or depicted on this site. Such intellectual property remains the property of its respective owners, and any references here are made solely for identification or informational purposes, without implying any affiliation, endorsement, or partnership.
We make no representations or warranties, express or implied, regarding the accuracy, completeness, or suitability of any content or products presented. Nothing on this website should be construed as legal, tax, investment, financial, medical, or other professional advice. In addition, no part of this site—including articles or product references—constitutes a solicitation, recommendation, endorsement, advertisement, or offer to buy or sell any securities, franchises, or other financial instruments, particularly in jurisdictions where such activity would be unlawful.
All content is of a general nature and may not address the specific circumstances of any individual or entity. It is not a substitute for professional advice or services. Any actions you take based on the information provided here are strictly at your own risk. You accept full responsibility for any decisions or outcomes arising from your use of this website and agree to release us from any liability in connection with your use of, or reliance upon, the content or products found herein.