
|
Nippon Paint Holdings Co., Ltd. (4612.T) Valoración de DCF |
Completamente Editable: Adáptelo A Sus Necesidades En Excel O Sheets
Diseño Profesional: Plantillas Confiables Y Estándares De La Industria
Predeterminadas Para Un Uso Rápido Y Eficiente
Compatible con MAC / PC, completamente desbloqueado
No Se Necesita Experiencia; Fáciles De Seguir
Nippon Paint Holdings Co., Ltd. (4612.T) Bundle
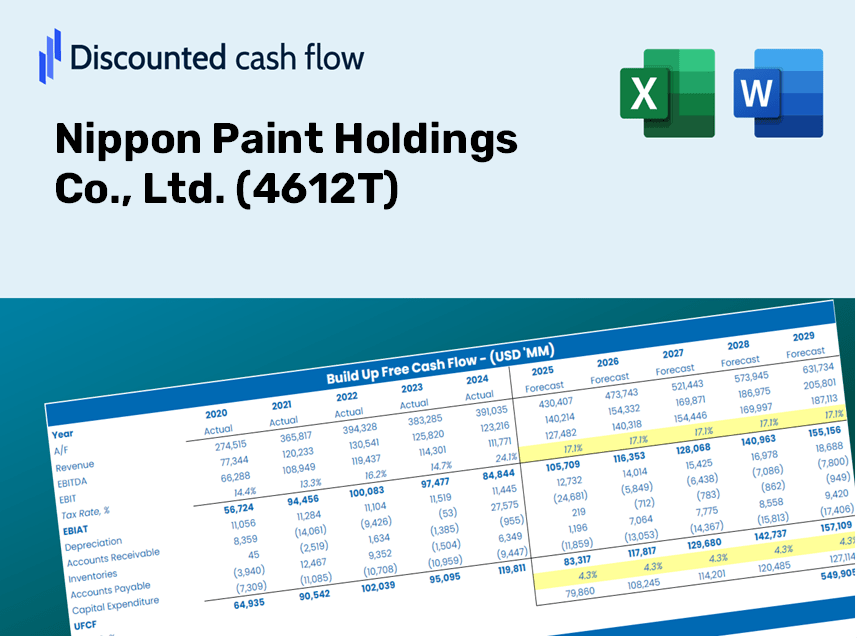
Ya sea que sea un inversor o analista, esta calculadora DCF (4612T) es su herramienta esencial para una valoración precisa. Precedido con los datos reales de Nippon Paint Holdings Co., Ltd., puede ajustar los pronósticos y observar instantáneamente los efectos.
Discounted Cash Flow (DCF) - (USD MM)
| Year | AY1 2020 |
AY2 2021 |
AY3 2022 |
AY4 2023 |
AY5 2024 |
FY1 2025 |
FY2 2026 |
FY3 2027 |
FY4 2028 |
FY5 2029 |
|---|---|---|---|---|---|---|---|---|---|---|
| Revenue | 772,560.0 | 998,276.0 | 1,309,021.0 | 1,442,574.0 | 1,638,720.0 | 1,983,442.2 | 2,400,680.3 | 2,905,688.9 | 3,516,931.5 | 4,256,755.4 |
| Revenue Growth, % | 0 | 29.22 | 31.13 | 10.2 | 13.6 | 21.04 | 21.04 | 21.04 | 21.04 | 21.04 |
| EBITDA | 123,211.0 | 123,923.0 | 163,417.0 | 227,967.0 | 251,342.0 | 285,562.2 | 345,633.2 | 418,340.8 | 506,343.3 | 612,858.0 |
| EBITDA, % | 15.95 | 12.41 | 12.48 | 15.8 | 15.34 | 14.4 | 14.4 | 14.4 | 14.4 | 14.4 |
| Depreciation | 29,446.0 | 33,889.0 | 47,116.0 | 52,275.0 | 63,693.0 | 72,657.7 | 87,942.0 | 106,441.5 | 128,832.6 | 155,933.9 |
| Depreciation, % | 3.81 | 3.39 | 3.6 | 3.62 | 3.89 | 3.66 | 3.66 | 3.66 | 3.66 | 3.66 |
| EBIT | 93,765.0 | 90,034.0 | 116,301.0 | 175,692.0 | 187,649.0 | 212,904.5 | 257,691.2 | 311,899.3 | 377,510.7 | 456,924.1 |
| EBIT, % | 12.14 | 9.02 | 8.88 | 12.18 | 11.45 | 10.73 | 10.73 | 10.73 | 10.73 | 10.73 |
| Total Cash | 232,134.0 | 138,813.0 | 242,598.0 | 289,647.0 | 288,301.0 | 397,311.1 | 480,889.8 | 582,050.0 | 704,490.4 | 852,687.5 |
| Total Cash, percent | .0 | .0 | .0 | .0 | .0 | .0 | .0 | .0 | .0 | .0 |
| Account Receivables | 240,653.0 | 266,908.0 | 311,305.0 | 317,940.0 | 376,976.0 | 502,654.0 | 608,392.6 | 736,374.5 | 891,278.7 | 1,078,768.6 |
| Account Receivables, % | 31.15 | 26.74 | 23.78 | 22.04 | 23 | 25.34 | 25.34 | 25.34 | 25.34 | 25.34 |
| Inventories | 94,055.0 | 132,798.0 | 176,049.0 | 175,617.0 | 202,484.0 | 251,723.4 | 304,676.1 | 368,767.9 | 446,342.2 | 540,235.0 |
| Inventories, % | 12.17 | 13.3 | 13.45 | 12.17 | 12.36 | 12.69 | 12.69 | 12.69 | 12.69 | 12.69 |
| Accounts Payable | 161,525.0 | 209,686.0 | 256,835.0 | 262,152.0 | 292,513.0 | 386,991.7 | 468,399.5 | 566,932.3 | 686,192.5 | 830,540.4 |
| Accounts Payable, % | 20.91 | 21 | 19.62 | 18.17 | 17.85 | 19.51 | 19.51 | 19.51 | 19.51 | 19.51 |
| Capital Expenditure | -28,761.0 | -39,382.0 | -41,017.0 | -38,110.0 | -48,997.0 | -65,187.8 | -78,900.7 | -95,498.3 | -115,587.4 | -139,902.4 |
| Capital Expenditure, % | -3.72 | -3.95 | -3.13 | -2.64 | -2.99 | -3.29 | -3.29 | -3.29 | -3.29 | -3.29 |
| Tax Rate, % | 29.85 | 29.85 | 29.85 | 29.85 | 29.85 | 29.85 | 29.85 | 29.85 | 29.85 | 29.85 |
| EBITAT | 46,043.3 | 70,356.4 | 88,390.8 | 128,887.2 | 131,635.1 | 147,653.7 | 178,714.2 | 216,308.7 | 261,811.5 | 316,886.3 |
| Depreciation | ||||||||||
| Changes in Account Receivables | ||||||||||
| Changes in Inventories | ||||||||||
| Changes in Accounts Payable | ||||||||||
| Capital Expenditure | ||||||||||
| UFCF | -126,454.7 | 48,026.4 | 53,990.8 | 142,166.2 | 90,789.1 | 74,684.9 | 110,472.0 | 133,710.9 | 161,838.5 | 195,882.9 |
| WACC, % | 7.04 | 7.29 | 7.27 | 7.25 | 7.22 | 7.22 | 7.22 | 7.22 | 7.22 | 7.22 |
| PV UFCF | ||||||||||
| SUM PV UFCF | 534,976.3 | |||||||||
| Long Term Growth Rate, % | 3.50 | |||||||||
| Free cash flow (T + 1) | 202,739 | |||||||||
| Terminal Value | 5,455,106 | |||||||||
| Present Terminal Value | 3,850,305 | |||||||||
| Enterprise Value | 4,385,281 | |||||||||
| Net Debt | 471,712 | |||||||||
| Equity Value | 3,913,569 | |||||||||
| Diluted Shares Outstanding, MM | 2,349 | |||||||||
| Equity Value Per Share | 1,666.22 |
Benefits You Will Receive
- Flexible Forecast Inputs: Modify key assumptions (growth %, margins, WACC) to explore various scenarios.
- Pre-Populated Financial Data: Nippon Paint Holdings Co., Ltd. (4612T) financials included for a quick start to your analysis.
- Automatic DCF Calculations: The template computes Net Present Value (NPV) and intrinsic value automatically.
- Professional and Tailored: An expertly designed Excel model that fits your valuation requirements.
- Designed for Analysts and Investors: Perfect for evaluating projections, confirming strategies, and enhancing efficiency.
Key Features
- Real-Life 4612T Data: Pre-loaded with Nippon Paint’s historical financials and forward-looking projections.
- Fully Customizable Inputs: Modify revenue growth, profit margins, WACC, tax rates, and capital expenditures to suit your analysis.
- Dynamic Valuation Model: Automatically updates Net Present Value (NPV) and intrinsic value based on your custom inputs.
- Scenario Testing: Generate multiple forecasting scenarios to explore various valuation outcomes.
- User-Friendly Design: Intuitive, organized, and crafted for both professionals and newcomers.
How It Works
- Step 1: Download the prebuilt Excel template featuring Nippon Paint Holdings Co., Ltd. (4612T) data.
- Step 2: Navigate through the populated sheets to grasp the essential metrics.
- Step 3: Adjust forecasts and assumptions in the editable yellow cells (WACC, growth, margins).
- Step 4: Instantly see recalculated results, including the intrinsic value of Nippon Paint Holdings Co., Ltd. (4612T).
- Step 5: Make well-informed investment decisions or create reports based on the outputs.
Why Opt for Nippon Paint Holdings Co., Ltd. (4612T) Calculator?
- Precision: Utilizes authentic Nippon Paint financials for reliable data integrity.
- Adaptability: Crafted to allow users to effortlessly adjust and experiment with inputs.
- Efficiency: Avoid the complexity of constructing a financial model from the ground up.
- Enterprise-Quality: Designed with the expertise and functionality expected at the CFO level.
- Intuitive: Simple to navigate, making it accessible for users without extensive financial modeling skills.
Who Should Use This Product?
- Institutional Investors: Create comprehensive and accurate valuation models for analyzing investments in Nippon Paint Holdings Co., Ltd. (4612T).
- Corporate Finance Departments: Evaluate valuation scenarios to inform strategic decisions within their organizations.
- Financial Consultants and Advisors: Offer clients precise valuation insights for Nippon Paint Holdings Co., Ltd. (4612T).
- Students and Instructors: Utilize real-world data to learn and teach financial modeling techniques.
- Industry Analysts: Gain a deeper understanding of how companies like Nippon Paint Holdings Co., Ltd. (4612T) are appraised in the market.
Contents of the Template
- Pre-Filled Data: Contains Nippon Paint's historical financial data and forecasts.
- Discounted Cash Flow Model: An editable DCF valuation model featuring automated calculations.
- Weighted Average Cost of Capital (WACC): A dedicated section to compute WACC using custom inputs.
- Key Financial Ratios: Evaluate Nippon Paint's profitability, efficiency, and leverage.
- Customizable Inputs: Easily adjust revenue growth, profit margins, and tax rates.
- Clear Dashboard: Visualizations and tables providing a summary of key valuation outcomes.
Disclaimer
All information, articles, and product details provided on this website are for general informational and educational purposes only. We do not claim any ownership over, nor do we intend to infringe upon, any trademarks, copyrights, logos, brand names, or other intellectual property mentioned or depicted on this site. Such intellectual property remains the property of its respective owners, and any references here are made solely for identification or informational purposes, without implying any affiliation, endorsement, or partnership.
We make no representations or warranties, express or implied, regarding the accuracy, completeness, or suitability of any content or products presented. Nothing on this website should be construed as legal, tax, investment, financial, medical, or other professional advice. In addition, no part of this site—including articles or product references—constitutes a solicitation, recommendation, endorsement, advertisement, or offer to buy or sell any securities, franchises, or other financial instruments, particularly in jurisdictions where such activity would be unlawful.
All content is of a general nature and may not address the specific circumstances of any individual or entity. It is not a substitute for professional advice or services. Any actions you take based on the information provided here are strictly at your own risk. You accept full responsibility for any decisions or outcomes arising from your use of this website and agree to release us from any liability in connection with your use of, or reliance upon, the content or products found herein.