
|
Kansai Paint Co., Ltd. (4613.T) Valoración de DCF |
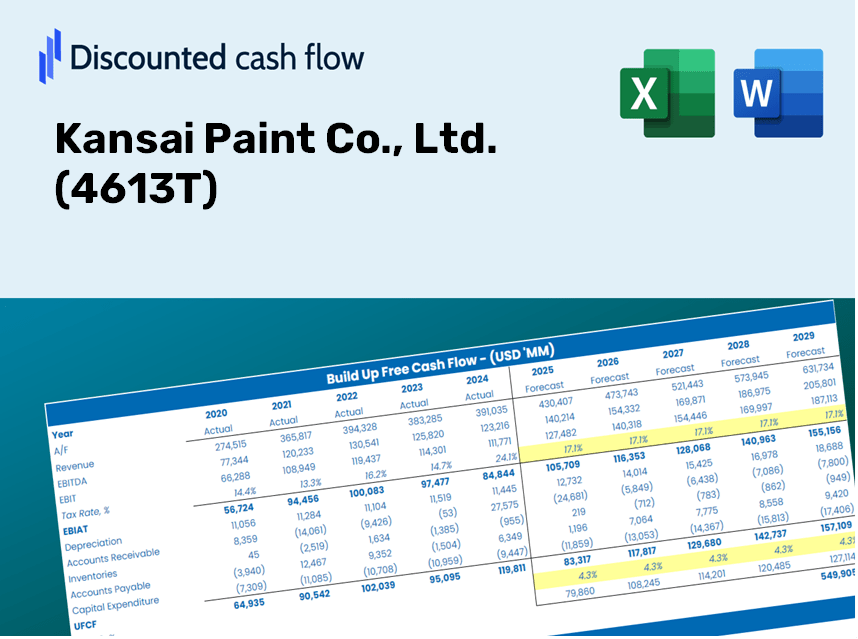
Completamente Editable: Adáptelo A Sus Necesidades En Excel O Sheets
Diseño Profesional: Plantillas Confiables Y Estándares De La Industria
Predeterminadas Para Un Uso Rápido Y Eficiente
Compatible con MAC / PC, completamente desbloqueado
No Se Necesita Experiencia; Fáciles De Seguir
Kansai Paint Co., Ltd. (4613.T) Bundle
¡Simplifique la valoración de Kansai Paint Co., Ltd. (4613t) con esta calculadora DCF personalizable! Con Real Kansai Paint Co., Ltd. (4613T) financieras y entradas de pronóstico ajustables, puede probar escenarios y descubrir Kansai Paint Co., Ltd. (4613T) Valor razonable en minutos.
Discounted Cash Flow (DCF) - (USD MM)
| Year | AY1 2021 |
AY2 2022 |
AY3 2023 |
AY4 2024 |
AY5 2025 |
FY1 2026 |
FY2 2027 |
FY3 2028 |
FY4 2029 |
FY5 2030 |
|---|---|---|---|---|---|---|---|---|---|---|
| Revenue | 364,620.0 | 419,190.0 | 509,070.0 | 562,277.0 | 588,825.0 | 664,755.4 | 750,477.1 | 847,252.9 | 956,508.2 | 1,079,852.1 |
| Revenue Growth, % | 0 | 14.97 | 21.44 | 10.45 | 4.72 | 12.9 | 12.9 | 12.9 | 12.9 | 12.9 |
| EBITDA | 60,231.0 | 48,113.0 | 64,412.0 | 133,003.0 | 94,162.0 | 106,753.3 | 120,519.4 | 136,060.7 | 153,606.0 | 173,413.9 |
| EBITDA, % | 16.52 | 11.48 | 12.65 | 23.65 | 15.99 | 16.06 | 16.06 | 16.06 | 16.06 | 16.06 |
| Depreciation | 17,820.0 | 18,015.0 | 19,615.0 | 22,535.0 | 25,841.0 | 28,497.2 | 32,172.0 | 36,320.6 | 41,004.2 | 46,291.8 |
| Depreciation, % | 4.89 | 4.3 | 3.85 | 4.01 | 4.39 | 4.29 | 4.29 | 4.29 | 4.29 | 4.29 |
| EBIT | 42,411.0 | 30,098.0 | 44,797.0 | 110,468.0 | 68,321.0 | 78,256.1 | 88,347.4 | 99,740.1 | 112,601.8 | 127,122.0 |
| EBIT, % | 11.63 | 7.18 | 8.8 | 19.65 | 11.6 | 11.77 | 11.77 | 11.77 | 11.77 | 11.77 |
| Total Cash | 124,446.0 | 68,091.0 | 95,142.0 | 100,796.0 | 109,145.0 | 140,297.5 | 158,389.2 | 178,813.8 | 201,872.3 | 227,904.2 |
| Total Cash, percent | .0 | .0 | .0 | .0 | .0 | .0 | .0 | .0 | .0 | .0 |
| Account Receivables | 101,860.0 | 106,379.0 | 102,259.0 | 108,364.0 | 114,866.0 | 149,145.4 | 168,378.0 | 190,090.7 | 214,603.4 | 242,277.0 |
| Account Receivables, % | 27.94 | 25.38 | 20.09 | 19.27 | 19.51 | 22.44 | 22.44 | 22.44 | 22.44 | 22.44 |
| Inventories | 65,666.0 | 89,218.0 | 105,395.0 | 104,323.0 | 111,928.0 | 129,705.3 | 146,431.1 | 165,313.7 | 186,631.3 | 210,697.9 |
| Inventories, % | 18.01 | 21.28 | 20.7 | 18.55 | 19.01 | 19.51 | 19.51 | 19.51 | 19.51 | 19.51 |
| Accounts Payable | 63,808.0 | 72,896.0 | 80,999.0 | 86,707.0 | 85,218.0 | 107,283.5 | 121,118.0 | 136,736.5 | 154,368.9 | 174,275.2 |
| Accounts Payable, % | 17.5 | 17.39 | 15.91 | 15.42 | 14.47 | 16.14 | 16.14 | 16.14 | 16.14 | 16.14 |
| Capital Expenditure | -11,316.0 | -15,837.0 | -11,112.0 | -20,066.0 | -20,105.0 | -21,335.2 | -24,086.5 | -27,192.5 | -30,699.0 | -34,657.7 |
| Capital Expenditure, % | -3.1 | -3.78 | -2.18 | -3.57 | -3.41 | -3.21 | -3.21 | -3.21 | -3.21 | -3.21 |
| Tax Rate, % | 41.31 | 41.31 | 41.31 | 41.31 | 41.31 | 41.31 | 41.31 | 41.31 | 41.31 | 41.31 |
| EBITAT | 20,804.5 | 18,212.2 | 25,964.7 | 68,404.4 | 40,098.9 | 45,097.3 | 50,912.7 | 57,478.0 | 64,890.0 | 73,257.7 |
| Depreciation | ||||||||||
| Changes in Account Receivables | ||||||||||
| Changes in Inventories | ||||||||||
| Changes in Accounts Payable | ||||||||||
| Capital Expenditure | ||||||||||
| UFCF | -76,409.5 | 1,407.2 | 30,513.7 | 71,548.4 | 30,238.9 | 22,268.1 | 36,874.2 | 41,629.3 | 46,997.5 | 53,057.9 |
| WACC, % | 4.44 | 4.56 | 4.53 | 4.57 | 4.54 | 4.53 | 4.53 | 4.53 | 4.53 | 4.53 |
| PV UFCF | ||||||||||
| SUM PV UFCF | 173,396.9 | |||||||||
| Long Term Growth Rate, % | 3.00 | |||||||||
| Free cash flow (T + 1) | 54,650 | |||||||||
| Terminal Value | 3,579,537 | |||||||||
| Present Terminal Value | 2,868,733 | |||||||||
| Enterprise Value | 3,042,130 | |||||||||
| Net Debt | 155,270 | |||||||||
| Equity Value | 2,886,860 | |||||||||
| Diluted Shares Outstanding, MM | 226 | |||||||||
| Equity Value Per Share | 12,788.83 |
Benefits You Will Receive
- Customizable Excel Template: A versatile Excel-based DCF Calculator featuring pre-populated financials for Kansai Paint Co., Ltd. (4613T).
- Accurate Data: Access to historical data and projected estimates (highlighted in the yellow cells).
- Adjustable Forecasts: Modify key assumptions such as revenue growth, EBITDA margin, and WACC.
- Instant Calculations: Quickly assess how your changes affect the valuation of Kansai Paint Co., Ltd. (4613T).
- Professional Resource: Designed for investors, CFOs, consultants, and financial analysts.
- Intuitive Layout: Organized for simplicity and ease of use, complete with step-by-step guidelines.
Key Features
- Authentic Kansai Paint Financials: Gain access to precise historical data and future forecasts tailored for Kansai Paint Co., Ltd. (4613T).
- Personalizable Forecast Parameters: Modify highlighted yellow cells for key metrics such as WACC, growth rates, and profit margins.
- Real-Time Calculations: Enjoy automatic updates to DCF, Net Present Value (NPV), and cash flow assessments.
- Interactive Dashboard: Utilize clear charts and summaries to effectively visualize your valuation outputs.
- Designed for All Skill Levels: An intuitive layout catering to investors, CFOs, and consultants, regardless of experience.
How It Works
- Step 1: Download the Excel file.
- Step 2: Review Kansai Paint Co., Ltd.'s pre-filled financial data and forecasts.
- Step 3: Adjust key inputs such as revenue growth, WACC, and tax rates (highlighted cells).
- Step 4: Observe the DCF model refresh in real-time as you modify your assumptions.
- Step 5: Evaluate the outputs and utilize the findings for investment decisions regarding Kansai Paint Co., Ltd. (4613T).
Why Opt for This Calculator?
- User-Friendly Design: Tailored for both novices and seasoned users.
- Customizable Inputs: Easily adjust parameters to suit your analysis.
- Real-Time Updates: Observe immediate effects on Kansai Paint’s valuation as inputs change.
- Pre-Configured: Comes with Kansai Paint’s actual financial data for swift assessments.
- Endorsed by Experts: Utilized by investors and analysts for informed decision-making.
Who Can Benefit from This Product?
- Finance Students: Master valuation techniques and practice with real data pertaining to Kansai Paint Co., Ltd. (4613T).
- Academics: Integrate advanced financial models into your curriculum or research focused on Kansai Paint Co., Ltd. (4613T).
- Investors: Evaluate your predictions and delve into the valuation results for Kansai Paint Co., Ltd. (4613T).
- Analysts: Enhance your productivity with a pre-constructed, adaptable DCF model tailored for Kansai Paint Co., Ltd. (4613T).
- Small Business Owners: Discover how major public companies like Kansai Paint Co., Ltd. (4613T) are assessed and analyzed.
Contents of the Template
- Historical Data: Provides Kansai Paint Co., Ltd.’s (4613T) previous financial performance and foundational forecasts.
- DCF and Levered DCF Models: Comprehensive templates for assessing the intrinsic value of Kansai Paint Co., Ltd. (4613T).
- WACC Sheet: Ready-to-use calculations for the Weighted Average Cost of Capital.
- Editable Inputs: Adjust essential parameters such as growth rates, EBITDA %, and CAPEX projections.
- Quarterly and Annual Statements: A thorough analysis of Kansai Paint Co., Ltd.’s (4613T) financial results.
- Interactive Dashboard: Dynamic visualization of valuation outcomes and forecasts.
Disclaimer
All information, articles, and product details provided on this website are for general informational and educational purposes only. We do not claim any ownership over, nor do we intend to infringe upon, any trademarks, copyrights, logos, brand names, or other intellectual property mentioned or depicted on this site. Such intellectual property remains the property of its respective owners, and any references here are made solely for identification or informational purposes, without implying any affiliation, endorsement, or partnership.
We make no representations or warranties, express or implied, regarding the accuracy, completeness, or suitability of any content or products presented. Nothing on this website should be construed as legal, tax, investment, financial, medical, or other professional advice. In addition, no part of this site—including articles or product references—constitutes a solicitation, recommendation, endorsement, advertisement, or offer to buy or sell any securities, franchises, or other financial instruments, particularly in jurisdictions where such activity would be unlawful.
All content is of a general nature and may not address the specific circumstances of any individual or entity. It is not a substitute for professional advice or services. Any actions you take based on the information provided here are strictly at your own risk. You accept full responsibility for any decisions or outcomes arising from your use of this website and agree to release us from any liability in connection with your use of, or reliance upon, the content or products found herein.