
|
SK Kaken Co., Ltd. (4628.T) Valoración de DCF |
Completamente Editable: Adáptelo A Sus Necesidades En Excel O Sheets
Diseño Profesional: Plantillas Confiables Y Estándares De La Industria
Predeterminadas Para Un Uso Rápido Y Eficiente
Compatible con MAC / PC, completamente desbloqueado
No Se Necesita Experiencia; Fáciles De Seguir
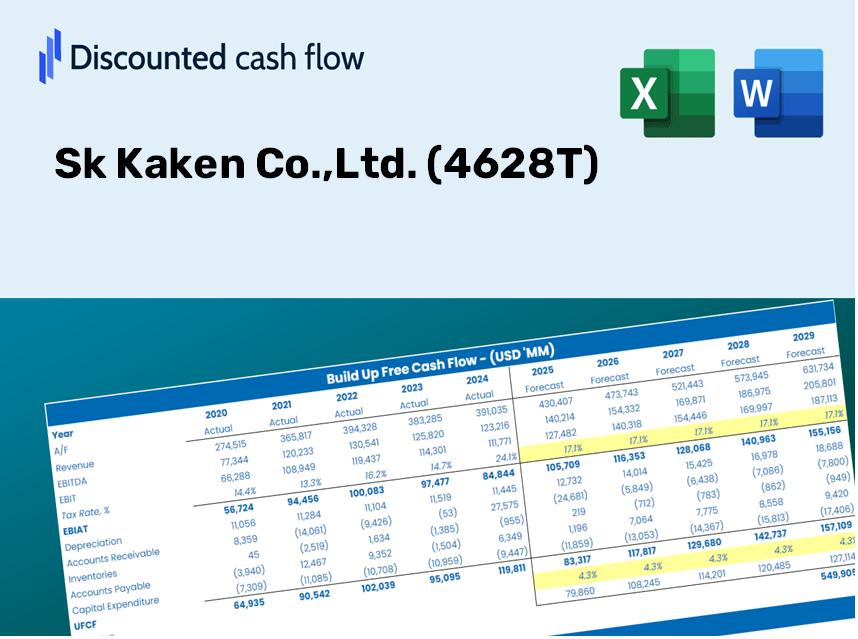
Sk Kaken Co.,Ltd. (4628.T) Bundle
¡Explore el potencial financiero de SK Kaken Co., Ltd. (4628T) con nuestra calculadora DCF fácil de usar! Ingrese sus suposiciones para el crecimiento, los márgenes y los costos para calcular el valor intrínseco de SK Kaken Co., Ltd. (4628T) y dar forma a su estrategia de inversión.
Discounted Cash Flow (DCF) - (USD MM)
| Year | AY1 2021 |
AY2 2022 |
AY3 2023 |
AY4 2024 |
AY5 2025 |
FY1 2026 |
FY2 2027 |
FY3 2028 |
FY4 2029 |
FY5 2030 |
|---|---|---|---|---|---|---|---|---|---|---|
| Revenue | 85,174.0 | 88,282.0 | 95,580.0 | 100,883.0 | 106,142.0 | 112,159.4 | 118,518.0 | 125,237.0 | 132,337.0 | 139,839.5 |
| Revenue Growth, % | 0 | 3.65 | 8.27 | 5.55 | 5.21 | 5.67 | 5.67 | 5.67 | 5.67 | 5.67 |
| EBITDA | 11,511.0 | 13,458.0 | 13,359.0 | 17,636.0 | 15,481.0 | 16,779.6 | 17,730.9 | 18,736.1 | 19,798.3 | 20,920.7 |
| EBITDA, % | 13.51 | 15.24 | 13.98 | 17.48 | 14.59 | 14.96 | 14.96 | 14.96 | 14.96 | 14.96 |
| Depreciation | 501.0 | 506.0 | 526.0 | 547.0 | 568.0 | 625.6 | 661.1 | 698.6 | 738.2 | 780.0 |
| Depreciation, % | 0.58821 | 0.57316 | 0.55032 | 0.54221 | 0.53513 | 0.55781 | 0.55781 | 0.55781 | 0.55781 | 0.55781 |
| EBIT | 11,010.0 | 12,952.0 | 12,833.0 | 17,089.0 | 14,913.0 | 16,154.0 | 17,069.8 | 18,037.5 | 19,060.1 | 20,140.7 |
| EBIT, % | 12.93 | 14.67 | 13.43 | 16.94 | 14.05 | 14.4 | 14.4 | 14.4 | 14.4 | 14.4 |
| Total Cash | 103,383.0 | 110,388.0 | 99,495.0 | 105,885.0 | 108,790.0 | 112,159.4 | 118,518.0 | 125,237.0 | 132,337.0 | 139,839.5 |
| Total Cash, percent | .0 | .0 | .0 | .0 | .0 | .0 | .0 | .0 | .0 | .0 |
| Account Receivables | 17,588.0 | 18,826.0 | 20,755.0 | 22,103.0 | 21,710.0 | 23,789.6 | 25,138.2 | 26,563.4 | 28,069.3 | 29,660.6 |
| Account Receivables, % | 20.65 | 21.32 | 21.71 | 21.91 | 20.45 | 21.21 | 21.21 | 21.21 | 21.21 | 21.21 |
| Inventories | 6,155.0 | 7,256.0 | 7,733.0 | 8,140.0 | 8,613.0 | 8,909.8 | 9,414.9 | 9,948.7 | 10,512.7 | 11,108.7 |
| Inventories, % | 7.23 | 8.22 | 8.09 | 8.07 | 8.11 | 7.94 | 7.94 | 7.94 | 7.94 | 7.94 |
| Accounts Payable | 5,747.0 | 7,381.0 | 9,557.0 | 8,787.0 | 7,610.0 | 9,194.1 | 9,715.3 | 10,266.1 | 10,848.1 | 11,463.1 |
| Accounts Payable, % | 6.75 | 8.36 | 10 | 8.71 | 7.17 | 8.2 | 8.2 | 8.2 | 8.2 | 8.2 |
| Capital Expenditure | -686.0 | -100.0 | -234.0 | -671.0 | -1,374.0 | -700.6 | -740.3 | -782.3 | -826.6 | -873.5 |
| Capital Expenditure, % | -0.80541 | -0.11327 | -0.24482 | -0.66513 | -1.29 | -0.62462 | -0.62462 | -0.62462 | -0.62462 | -0.62462 |
| Tax Rate, % | 27.87 | 27.87 | 27.87 | 27.87 | 27.87 | 27.87 | 27.87 | 27.87 | 27.87 | 27.87 |
| EBITAT | 7,062.0 | 8,849.4 | 9,055.2 | 11,846.5 | 10,757.1 | 11,129.6 | 11,760.5 | 12,427.2 | 13,131.8 | 13,876.2 |
| Depreciation | ||||||||||
| Changes in Account Receivables | ||||||||||
| Changes in Inventories | ||||||||||
| Changes in Accounts Payable | ||||||||||
| Capital Expenditure | ||||||||||
| UFCF | -11,119.0 | 8,550.4 | 9,117.2 | 9,197.5 | 8,694.1 | 10,262.3 | 10,348.8 | 10,935.5 | 11,555.4 | 12,210.5 |
| WACC, % | 4.48 | 4.48 | 4.49 | 4.48 | 4.49 | 4.48 | 4.48 | 4.48 | 4.48 | 4.48 |
| PV UFCF | ||||||||||
| SUM PV UFCF | 48,390.8 | |||||||||
| Long Term Growth Rate, % | 2.00 | |||||||||
| Free cash flow (T + 1) | 12,455 | |||||||||
| Terminal Value | 501,470 | |||||||||
| Present Terminal Value | 402,721 | |||||||||
| Enterprise Value | 451,111 | |||||||||
| Net Debt | -105,790 | |||||||||
| Equity Value | 556,901 | |||||||||
| Diluted Shares Outstanding, MM | 13 | |||||||||
| Equity Value Per Share | 41,294.78 |
What You Will Receive
- Customizable Excel Template: A fully adaptable Excel-based DCF Calculator featuring pre-loaded financial data for SK Kaken Co.,Ltd. (4628T).
- Real-World Insights: Access to historical performance data and projected estimates (highlighted in the yellow cells).
- Flexible Forecasting: Adjust key assumptions such as revenue growth, EBITDA margin, and WACC.
- Instant Calculations: Quickly observe how your input variables influence the valuation of SK Kaken Co.,Ltd. (4628T).
- Professional Resource: Designed for use by investors, CFOs, consultants, and financial analysts.
- Intuitive Interface: Organized for simplicity and ease of navigation, complete with step-by-step guidance.
Key Features
- Comprehensive Historical Data: Access Sk Kaken Co., Ltd.’s (4628T) past financial statements and established forecasts.
- Customizable Parameters: Modify WACC, tax rates, revenue growth, and EBITDA margins as needed.
- Real-Time Calculations: Watch the intrinsic value of Sk Kaken Co., Ltd. (4628T) update instantly.
- Insightful Visualizations: Use dashboard charts to view valuation outcomes and essential metrics.
- Precision-Focused Design: A sophisticated tool tailored for analysts, investors, and finance professionals.
How It Operates
- Step 1: Download the Excel spreadsheet.
- Step 2: Examine the pre-filled data for Sk Kaken Co.,Ltd. (4628T) (historical and forecasted).
- Step 3: Modify key assumptions (highlighted in yellow) based on your insights.
- Step 4: Observe the automatic recalculations of Sk Kaken Co.,Ltd.'s (4628T) intrinsic value.
- Step 5: Utilize the results for your investment strategies or reporting needs.
Why Opt for This Calculator?
- User-Friendly Interface: Crafted to cater to both novices and seasoned professionals.
- Customizable Assumptions: Effortlessly adjust inputs to suit your analytical needs.
- Real-Time Updates: Witness immediate changes in Sk Kaken Co., Ltd.’s (4628T) valuation as you make adjustments.
- Pre-Configured: Comes with Sk Kaken’s actual financial data for swift evaluations.
- Relied Upon by Experts: Favored by investors and analysts for sound decision-making.
Who Can Benefit from Sk Kaken Co., Ltd. (4628T)?
- Investors: Enhance your investment decisions with a reliable and professional valuation tool.
- Financial Analysts: Streamline your workflow with a customizable DCF model designed for efficiency.
- Consultants: Easily modify the template for impactful client presentations and reports.
- Finance Enthusiasts: Expand your knowledge of valuation methods through practical, real-world scenarios.
- Educators and Students: Utilize it as an effective resource for learning in finance-centric courses.
What the Template Includes
- Operating and Balance Sheet Data: Pre-filled historical data and forecasts for Sk Kaken Co.,Ltd. (4628T), covering metrics like revenue, EBITDA, EBIT, and capital expenditures.
- WACC Calculation: A dedicated section for calculating the Weighted Average Cost of Capital (WACC), featuring parameters such as Beta, risk-free rate, and share price.
- DCF Valuation (Unlevered and Levered): Customizable Discounted Cash Flow models that detail intrinsic value along with comprehensive calculations.
- Financial Statements: Pre-loaded financial statements (annual and quarterly) tailored for in-depth analysis.
- Key Ratios: Provides profitability, leverage, and efficiency ratios specifically for Sk Kaken Co.,Ltd. (4628T).
- Dashboard and Charts: A visual overview of valuation outputs and assumptions to facilitate easy analysis of results.
Disclaimer
All information, articles, and product details provided on this website are for general informational and educational purposes only. We do not claim any ownership over, nor do we intend to infringe upon, any trademarks, copyrights, logos, brand names, or other intellectual property mentioned or depicted on this site. Such intellectual property remains the property of its respective owners, and any references here are made solely for identification or informational purposes, without implying any affiliation, endorsement, or partnership.
We make no representations or warranties, express or implied, regarding the accuracy, completeness, or suitability of any content or products presented. Nothing on this website should be construed as legal, tax, investment, financial, medical, or other professional advice. In addition, no part of this site—including articles or product references—constitutes a solicitation, recommendation, endorsement, advertisement, or offer to buy or sell any securities, franchises, or other financial instruments, particularly in jurisdictions where such activity would be unlawful.
All content is of a general nature and may not address the specific circumstances of any individual or entity. It is not a substitute for professional advice or services. Any actions you take based on the information provided here are strictly at your own risk. You accept full responsibility for any decisions or outcomes arising from your use of this website and agree to release us from any liability in connection with your use of, or reliance upon, the content or products found herein.