
|
Obic Co., Ltd. (4684.t) valoración de DCF |
Completamente Editable: Adáptelo A Sus Necesidades En Excel O Sheets
Diseño Profesional: Plantillas Confiables Y Estándares De La Industria
Predeterminadas Para Un Uso Rápido Y Eficiente
Compatible con MAC / PC, completamente desbloqueado
No Se Necesita Experiencia; Fáciles De Seguir
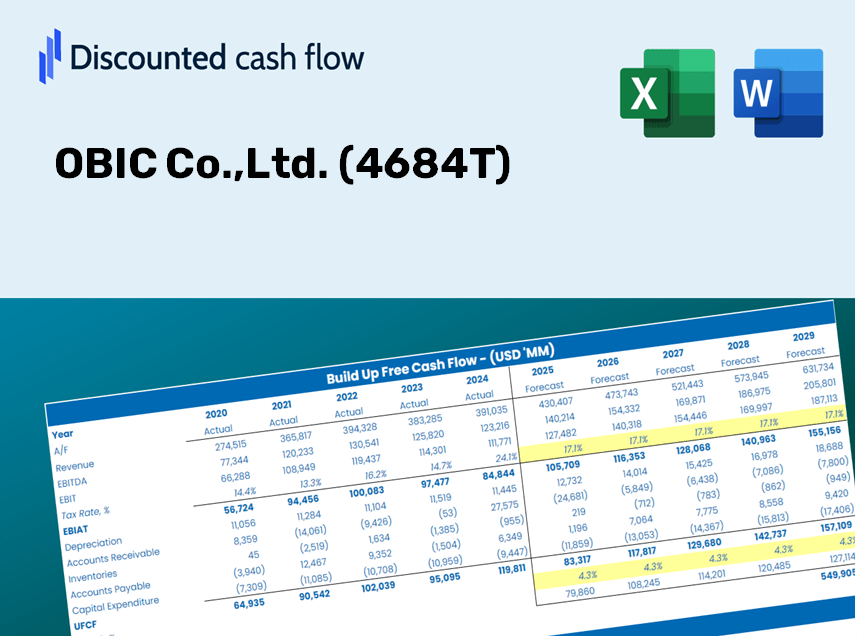
OBIC Co.,Ltd. (4684.T) Bundle
¡Agilice su análisis y mejore la precisión con nuestra calculadora DCF (4684T)! Utilizando datos de Real Obic Co., Ltd. y suposiciones personalizables, esta herramienta le permite pronosticar, analizar y evaluar Obic Co., Ltd. como un inversor experimentado.
Discounted Cash Flow (DCF) - (USD MM)
| Year | AY1 2021 |
AY2 2022 |
AY3 2023 |
AY4 2024 |
AY5 2025 |
FY1 2026 |
FY2 2027 |
FY3 2028 |
FY4 2029 |
FY5 2030 |
|---|---|---|---|---|---|---|---|---|---|---|
| Revenue | 83,862.0 | 89,476.0 | 100,167.0 | 111,590.0 | 121,240.0 | 132,968.3 | 145,831.1 | 159,938.3 | 175,410.1 | 192,378.6 |
| Revenue Growth, % | 0 | 6.69 | 11.95 | 11.4 | 8.65 | 9.67 | 9.67 | 9.67 | 9.67 | 9.67 |
| EBITDA | 50,318.0 | 56,565.0 | 65,002.0 | 73,443.0 | 92,767.0 | 87,876.8 | 96,377.7 | 105,700.9 | 115,926.0 | 127,140.3 |
| EBITDA, % | 60 | 63.22 | 64.89 | 65.82 | 76.52 | 66.09 | 66.09 | 66.09 | 66.09 | 66.09 |
| Depreciation | 2,240.0 | 2,429.0 | 2,511.0 | 2,532.0 | 2,687.0 | 3,291.7 | 3,610.2 | 3,959.4 | 4,342.4 | 4,762.5 |
| Depreciation, % | 2.67 | 2.71 | 2.51 | 2.27 | 2.22 | 2.48 | 2.48 | 2.48 | 2.48 | 2.48 |
| EBIT | 48,078.0 | 54,136.0 | 62,491.0 | 70,911.0 | 90,080.0 | 84,585.1 | 92,767.6 | 101,741.5 | 111,583.6 | 122,377.8 |
| EBIT, % | 57.33 | 60.5 | 62.39 | 63.55 | 74.3 | 63.61 | 63.61 | 63.61 | 63.61 | 63.61 |
| Total Cash | 150,745.0 | 122,699.0 | 156,321.0 | 170,244.0 | 200,065.0 | 132,968.3 | 145,831.1 | 159,938.3 | 175,410.1 | 192,378.6 |
| Total Cash, percent | .0 | .0 | .0 | .0 | .0 | .0 | .0 | .0 | .0 | .0 |
| Account Receivables | 11,034.0 | 12,023.0 | 13,851.0 | 15,312.0 | 17,857.0 | 18,315.8 | 20,087.6 | 22,030.7 | 24,161.9 | 26,499.3 |
| Account Receivables, % | 13.16 | 13.44 | 13.83 | 13.72 | 14.73 | 13.77 | 13.77 | 13.77 | 13.77 | 13.77 |
| Inventories | 335.0 | 308.0 | 366.0 | 344.0 | 384.0 | 461.2 | 505.8 | 554.7 | 608.4 | 667.2 |
| Inventories, % | 0.39947 | 0.34423 | 0.36539 | 0.30827 | 0.31673 | 0.34682 | 0.34682 | 0.34682 | 0.34682 | 0.34682 |
| Accounts Payable | 3,523.0 | 3,606.0 | 4,186.0 | 4,662.0 | 5,246.0 | 5,562.0 | 6,100.1 | 6,690.2 | 7,337.4 | 8,047.1 |
| Accounts Payable, % | 4.2 | 4.03 | 4.18 | 4.18 | 4.33 | 4.18 | 4.18 | 4.18 | 4.18 | 4.18 |
| Capital Expenditure | -1,112.0 | -1,910.0 | -1,159.0 | -3,762.0 | -2,068.0 | -2,578.2 | -2,827.6 | -3,101.1 | -3,401.1 | -3,730.1 |
| Capital Expenditure, % | -1.33 | -2.13 | -1.16 | -3.37 | -1.71 | -1.94 | -1.94 | -1.94 | -1.94 | -1.94 |
| Tax Rate, % | 28.26 | 28.26 | 28.26 | 28.26 | 28.26 | 28.26 | 28.26 | 28.26 | 28.26 | 28.26 |
| EBITAT | 34,547.5 | 39,384.5 | 44,596.6 | 50,733.1 | 64,619.6 | 60,775.0 | 66,654.2 | 73,102.0 | 80,173.6 | 87,929.3 |
| Depreciation | ||||||||||
| Changes in Account Receivables | ||||||||||
| Changes in Inventories | ||||||||||
| Changes in Accounts Payable | ||||||||||
| Capital Expenditure | ||||||||||
| UFCF | 27,829.5 | 39,024.5 | 44,642.6 | 48,540.1 | 63,237.6 | 61,268.7 | 66,158.4 | 72,558.3 | 79,577.3 | 87,275.3 |
| WACC, % | 6.83 | 6.83 | 6.83 | 6.83 | 6.83 | 6.83 | 6.83 | 6.83 | 6.83 | 6.83 |
| PV UFCF | ||||||||||
| SUM PV UFCF | 298,613.1 | |||||||||
| Long Term Growth Rate, % | 3.00 | |||||||||
| Free cash flow (T + 1) | 89,894 | |||||||||
| Terminal Value | 2,344,251 | |||||||||
| Present Terminal Value | 1,684,394 | |||||||||
| Enterprise Value | 1,983,007 | |||||||||
| Net Debt | -200,065 | |||||||||
| Equity Value | 2,183,072 | |||||||||
| Diluted Shares Outstanding, MM | 440 | |||||||||
| Equity Value Per Share | 4,962.96 |
What You Will Receive
- Ready-to-Use Financial Model: Utilize OBIC Co., Ltd.’s actual data for accurate DCF valuation.
- Comprehensive Forecast Control: Modify key metrics such as revenue growth, profit margins, WACC, and more.
- Real-Time Calculations: Automatic updates let you view results instantly as you make adjustments.
- Professional-Grade Template: A polished Excel file crafted for high-quality valuation processes.
- Flexible and Reusable: Designed for adaptability, allowing ongoing use for in-depth forecasts.
Key Features
- 🔍 Real-Life OBIC Financials: Pre-filled historical and projected data for OBIC Co.,Ltd. (4684T).
- ✏️ Fully Customizable Inputs: Adjust all critical parameters (yellow cells) such as WACC, growth %, and tax rates.
- 📊 Professional DCF Valuation: Integrated formulas calculate OBIC’s intrinsic value using the Discounted Cash Flow method.
- ⚡ Instant Results: Visualize OBIC’s valuation instantly after making changes.
- Scenario Analysis: Test and compare outcomes for various financial assumptions side-by-side.
How It Functions
- Download: Obtain the pre-packaged Excel file featuring OBIC Co., Ltd.'s (4684T) financial data.
- Customize: Modify forecasts, such as revenue growth, EBITDA %, and WACC.
- Update Automatically: Watch the intrinsic value and NPV calculations refresh in real-time.
- Test Scenarios: Generate various projections and instantly compare the results.
- Make Decisions: Leverage the valuation findings to inform your investment choices.
Why Use OBIC's Calculator?
- User-Friendly Interface: Crafted for both newcomers and seasoned users.
- Customizable Inputs: Effortlessly adjust parameters to suit your analysis needs.
- Real-Time Feedback: Witness immediate changes in OBIC's valuation as you modify inputs.
- Preloaded Data: Comes with OBIC's actual financial figures for swift evaluations.
- Preferred by Industry Experts: Endorsed by investors and analysts for making strategic decisions.
Who Can Benefit from OBIC Co.,Ltd. (4684T)?
- Investors: Evaluate OBIC Co.,Ltd.’s valuation to make informed stock trading decisions.
- CFOs and Financial Analysts: Optimize valuation methods and validate financial forecasts.
- Startup Founders: Gain insights into the valuation practices of established companies like OBIC Co.,Ltd.
- Consultants: Provide comprehensive valuation reports to enhance client services.
- Students and Educators: Utilize actual market data to teach and learn valuation methodologies.
Contents of the Template
- Operating and Balance Sheet Data: Pre-filled historical data and forecasts for OBIC Co., Ltd. (4684T), including metrics such as revenue, EBITDA, EBIT, and capital expenditures.
- WACC Calculation: A dedicated sheet for calculating the Weighted Average Cost of Capital (WACC), featuring inputs like Beta, risk-free rate, and share price.
- DCF Valuation (Unlevered and Levered): Customizable Discounted Cash Flow models that reveal intrinsic value with comprehensive calculations.
- Financial Statements: Pre-loaded annual and quarterly financial statements for OBIC Co., Ltd. (4684T) to facilitate in-depth analysis.
- Key Ratios: A set of profitability, leverage, and efficiency ratios specific to OBIC Co., Ltd. (4684T).
- Dashboard and Charts: A visual overview of valuation outputs and assumptions that simplifies the analysis of results.
Disclaimer
All information, articles, and product details provided on this website are for general informational and educational purposes only. We do not claim any ownership over, nor do we intend to infringe upon, any trademarks, copyrights, logos, brand names, or other intellectual property mentioned or depicted on this site. Such intellectual property remains the property of its respective owners, and any references here are made solely for identification or informational purposes, without implying any affiliation, endorsement, or partnership.
We make no representations or warranties, express or implied, regarding the accuracy, completeness, or suitability of any content or products presented. Nothing on this website should be construed as legal, tax, investment, financial, medical, or other professional advice. In addition, no part of this site—including articles or product references—constitutes a solicitation, recommendation, endorsement, advertisement, or offer to buy or sell any securities, franchises, or other financial instruments, particularly in jurisdictions where such activity would be unlawful.
All content is of a general nature and may not address the specific circumstances of any individual or entity. It is not a substitute for professional advice or services. Any actions you take based on the information provided here are strictly at your own risk. You accept full responsibility for any decisions or outcomes arising from your use of this website and agree to release us from any liability in connection with your use of, or reliance upon, the content or products found herein.