
|
Otsuka Corporation (4768.T) Valoración de DCF |
Completamente Editable: Adáptelo A Sus Necesidades En Excel O Sheets
Diseño Profesional: Plantillas Confiables Y Estándares De La Industria
Predeterminadas Para Un Uso Rápido Y Eficiente
Compatible con MAC / PC, completamente desbloqueado
No Se Necesita Experiencia; Fáciles De Seguir
Otsuka Corporation (4768.T) Bundle
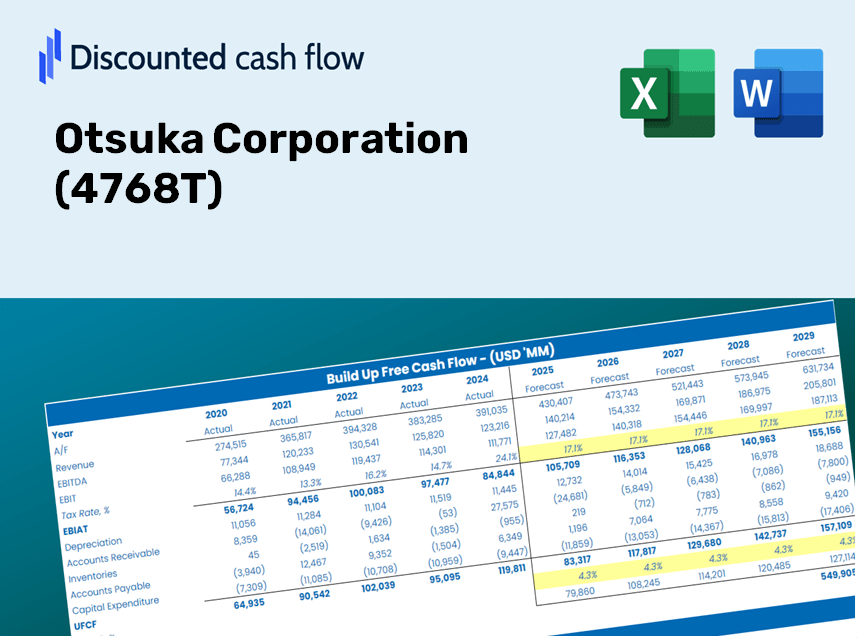
¿Busca evaluar el valor intrínseco de Otsuka Corporation? Nuestra calculadora DCF (4768T) integra datos del mundo real con características integrales de personalización, lo que le permite refinar sus pronósticos y tomar decisiones de inversión más informadas.
Discounted Cash Flow (DCF) - (USD MM)
| Year | AY1 2020 |
AY2 2021 |
AY3 2022 |
AY4 2023 |
AY5 2024 |
FY1 2025 |
FY2 2026 |
FY3 2027 |
FY4 2028 |
FY5 2029 |
|---|---|---|---|---|---|---|---|---|---|---|
| Revenue | 836,323.0 | 851,894.0 | 861,022.0 | 977,370.0 | 1,107,668.0 | 1,190,127.3 | 1,278,725.1 | 1,373,918.5 | 1,476,198.5 | 1,586,092.7 |
| Revenue Growth, % | 0 | 1.86 | 1.07 | 13.51 | 13.33 | 7.44 | 7.44 | 7.44 | 7.44 | 7.44 |
| EBITDA | 65,231.0 | 66,216.0 | 64,842.0 | 72,864.0 | 82,646.0 | 90,496.6 | 97,233.6 | 104,472.0 | 112,249.3 | 120,605.6 |
| EBITDA, % | 7.8 | 7.77 | 7.53 | 7.46 | 7.46 | 7.6 | 7.6 | 7.6 | 7.6 | 7.6 |
| Depreciation | 7,603.0 | 7,982.0 | 8,290.0 | 7,934.0 | 8,434.0 | 10,430.4 | 11,206.9 | 12,041.2 | 12,937.6 | 13,900.7 |
| Depreciation, % | 0.9091 | 0.93697 | 0.96281 | 0.81177 | 0.76142 | 0.87641 | 0.87641 | 0.87641 | 0.87641 | 0.87641 |
| EBIT | 57,628.0 | 58,234.0 | 56,552.0 | 64,930.0 | 74,212.0 | 80,066.2 | 86,026.6 | 92,430.8 | 99,311.7 | 106,704.9 |
| EBIT, % | 6.89 | 6.84 | 6.57 | 6.64 | 6.7 | 6.73 | 6.73 | 6.73 | 6.73 | 6.73 |
| Total Cash | 178,072.0 | 204,701.0 | 202,288.0 | 228,692.0 | 228,136.0 | 268,516.3 | 288,505.7 | 309,983.2 | 333,059.6 | 357,853.9 |
| Total Cash, percent | .0 | .0 | .0 | .0 | .0 | .0 | .0 | .0 | .0 | .0 |
| Account Receivables | 144,933.0 | 135,711.0 | 152,322.0 | 155,176.0 | 200,805.0 | 202,218.4 | 217,272.4 | 233,447.0 | 250,825.8 | 269,498.2 |
| Account Receivables, % | 17.33 | 15.93 | 17.69 | 15.88 | 18.13 | 16.99 | 16.99 | 16.99 | 16.99 | 16.99 |
| Inventories | 44,196.0 | 35,027.0 | 44,830.0 | 38,236.0 | 74,418.0 | 60,061.9 | 64,533.2 | 69,337.3 | 74,499.0 | 80,045.0 |
| Inventories, % | 5.28 | 4.11 | 5.21 | 3.91 | 6.72 | 5.05 | 5.05 | 5.05 | 5.05 | 5.05 |
| Accounts Payable | 96,437.0 | 91,938.0 | 99,517.0 | 105,485.0 | 162,266.0 | 141,204.7 | 151,716.5 | 163,010.9 | 175,146.1 | 188,184.6 |
| Accounts Payable, % | 11.53 | 10.79 | 11.56 | 10.79 | 14.65 | 11.86 | 11.86 | 11.86 | 11.86 | 11.86 |
| Capital Expenditure | -8,863.0 | -10,882.0 | -7,077.0 | -10,346.0 | -3,217.0 | -10,730.3 | -11,529.1 | -12,387.4 | -13,309.6 | -14,300.4 |
| Capital Expenditure, % | -1.06 | -1.28 | -0.82193 | -1.06 | -0.29043 | -0.90161 | -0.90161 | -0.90161 | -0.90161 | -0.90161 |
| Tax Rate, % | 27.57 | 27.57 | 27.57 | 27.57 | 27.57 | 27.57 | 27.57 | 27.57 | 27.57 | 27.57 |
| EBITAT | 39,339.0 | 39,957.2 | 40,052.5 | 47,475.8 | 53,750.4 | 56,566.7 | 60,777.7 | 65,302.2 | 70,163.6 | 75,386.9 |
| Depreciation | ||||||||||
| Changes in Account Receivables | ||||||||||
| Changes in Inventories | ||||||||||
| Changes in Accounts Payable | ||||||||||
| Capital Expenditure | ||||||||||
| UFCF | -54,613.0 | 50,949.2 | 22,430.5 | 54,771.8 | 33,937.4 | 48,148.1 | 51,442.1 | 55,271.7 | 59,386.3 | 63,807.3 |
| WACC, % | 4.86 | 4.86 | 4.86 | 4.86 | 4.86 | 4.86 | 4.86 | 4.86 | 4.86 | 4.86 |
| PV UFCF | ||||||||||
| SUM PV UFCF | 240,096.1 | |||||||||
| Long Term Growth Rate, % | 3.00 | |||||||||
| Free cash flow (T + 1) | 65,722 | |||||||||
| Terminal Value | 3,536,175 | |||||||||
| Present Terminal Value | 2,789,424 | |||||||||
| Enterprise Value | 3,029,520 | |||||||||
| Net Debt | -221,275 | |||||||||
| Equity Value | 3,250,795 | |||||||||
| Diluted Shares Outstanding, MM | 379 | |||||||||
| Equity Value Per Share | 8,572.74 |
What You Will Receive
- Genuine Otsuka Data: Preloaded financial metrics – covering revenue to EBIT – based on actual and forecasted figures.
- Complete Customization: Modify all essential parameters (yellow cells) such as WACC, growth %, and tax rates to suit your needs.
- Immediate Valuation Updates: Automatic recalculations enabling you to assess the effect of changes on Otsuka’s fair value.
- Flexible Excel Template: Designed for quick modifications, scenario analysis, and in-depth projections.
- Efficient and Accurate: Avoid the hassle of building models from the ground up while ensuring accuracy and adaptability.
Key Features
- Comprehensive Otsuka Financial Data: Pre-loaded with Otsuka Corporation’s historical financial metrics and future projections.
- Customizable Assumptions: Modify parameters such as revenue growth rates, profit margins, WACC, tax percentages, and capital investments.
- Adaptive Valuation Framework: Automated updates to Net Present Value (NPV) and intrinsic value according to your specified inputs.
- What-If Scenario Analysis: Develop various forecasting scenarios to evaluate different valuation possibilities.
- Intuitive User Interface: Easy-to-navigate, structured design tailored for both professionals and novices.
How It Functions
- Step 1: Download the Excel spreadsheet.
- Step 2: Examine the pre-loaded Otsuka Corporation (4768T) data (historical and future projections).
- Step 3: Modify the key assumptions (highlighted in yellow) according to your analysis.
- Step 4: Observe the automatic updates for Otsuka Corporation's intrinsic value.
- Step 5: Utilize the results for your investment strategies or reporting purposes.
Why Choose This Calculator for Otsuka Corporation (4768T)?
- Reliable Data: Utilize authentic Otsuka financials for dependable valuation outcomes.
- Flexible Options: Modify essential metrics such as growth rates, WACC, and tax rates to align with your forecasts.
- Efficiency Boost: Pre-configured calculations save you the hassle of starting from the ground up.
- Expert-Level Tool: Tailored for investors, financial analysts, and consultants.
- Easy to Use: Clear design and guided instructions cater to users of all experience levels.
Who Should Consider Using Otsuka Corporation (4768T)?
- Investors: Evaluate Otsuka's market valuation prior to making investment decisions.
- CFOs and Financial Analysts: Optimize valuation workflows and validate financial forecasts.
- Startup Founders: Gain insights into the valuation methods of established companies like Otsuka.
- Consultants: Provide comprehensive valuation reports for your clients using Otsuka as a case study.
- Students and Educators: Leverage real data from Otsuka to teach and practice valuation strategies.
Contents of the Template
- Detailed DCF Model: An editable template featuring precise valuation calculations.
- Real-World Financial Data: Otsuka Corporation’s (4768T) historical and projected financials are preloaded for your analysis.
- Adjustable Parameters: Modify WACC, growth rates, and tax assumptions to explore different scenarios.
- Comprehensive Financial Statements: Complete annual and quarterly financial breakdowns for in-depth insights.
- Key Financial Ratios: Integrated analysis covering profitability, efficiency, and leverage metrics.
- Dashboard with Visual Outputs: Visualizations including charts and tables for clear, actionable insights.
Disclaimer
All information, articles, and product details provided on this website are for general informational and educational purposes only. We do not claim any ownership over, nor do we intend to infringe upon, any trademarks, copyrights, logos, brand names, or other intellectual property mentioned or depicted on this site. Such intellectual property remains the property of its respective owners, and any references here are made solely for identification or informational purposes, without implying any affiliation, endorsement, or partnership.
We make no representations or warranties, express or implied, regarding the accuracy, completeness, or suitability of any content or products presented. Nothing on this website should be construed as legal, tax, investment, financial, medical, or other professional advice. In addition, no part of this site—including articles or product references—constitutes a solicitation, recommendation, endorsement, advertisement, or offer to buy or sell any securities, franchises, or other financial instruments, particularly in jurisdictions where such activity would be unlawful.
All content is of a general nature and may not address the specific circumstances of any individual or entity. It is not a substitute for professional advice or services. Any actions you take based on the information provided here are strictly at your own risk. You accept full responsibility for any decisions or outcomes arising from your use of this website and agree to release us from any liability in connection with your use of, or reliance upon, the content or products found herein.