
|
Sawai Group Holdings Co., Ltd. (4887.T) Valoración de DCF |
Completamente Editable: Adáptelo A Sus Necesidades En Excel O Sheets
Diseño Profesional: Plantillas Confiables Y Estándares De La Industria
Predeterminadas Para Un Uso Rápido Y Eficiente
Compatible con MAC / PC, completamente desbloqueado
No Se Necesita Experiencia; Fáciles De Seguir
Sawai Group Holdings Co., Ltd. (4887.T) Bundle
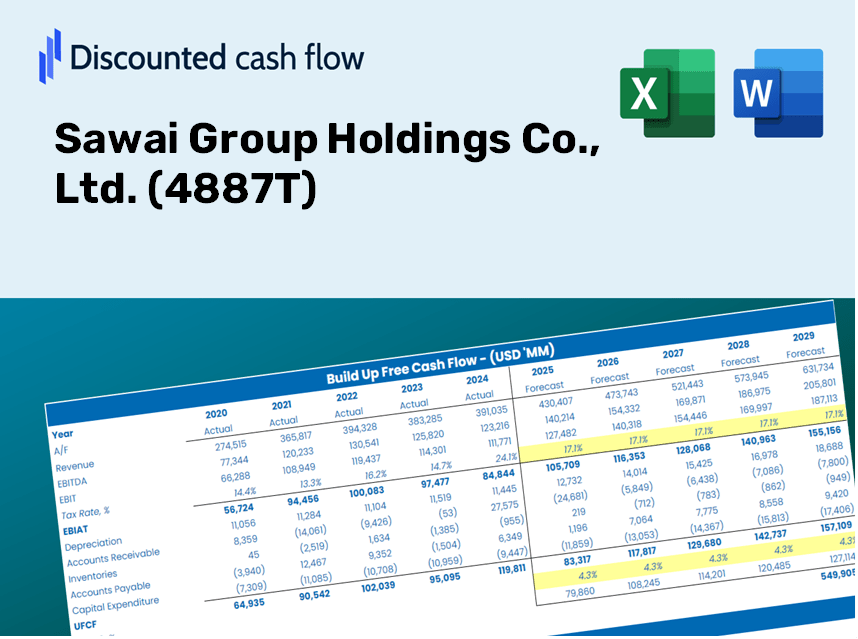
Ya sea que sea un inversionista o analista, esta calculadora DCF (4887T) es su recurso para una valoración precisa. Cargados con datos reales de Sawai Group Holdings Co., Ltd., puede ajustar los pronósticos y observar los efectos en tiempo real.
Discounted Cash Flow (DCF) - (USD MM)
| Year | AY1 2021 |
AY2 2022 |
AY3 2023 |
AY4 2024 |
AY5 2025 |
FY1 2026 |
FY2 2027 |
FY3 2028 |
FY4 2029 |
FY5 2030 |
|---|---|---|---|---|---|---|---|---|---|---|
| Revenue | 187,219.0 | 193,816.0 | 163,702.0 | 176,862.0 | 189,024.0 | 190,395.3 | 191,776.5 | 193,167.8 | 194,569.1 | 195,980.6 |
| Revenue Growth, % | 0 | 3.52 | -15.54 | 8.04 | 6.88 | 0.72545 | 0.72545 | 0.72545 | 0.72545 | 0.72545 |
| EBITDA | 37,253.0 | -18,709.0 | 33,932.0 | 36,873.0 | 36,199.0 | 27,025.5 | 27,221.5 | 27,419.0 | 27,617.9 | 27,818.3 |
| EBITDA, % | 19.9 | -9.65 | 20.73 | 20.85 | 19.15 | 14.19 | 14.19 | 14.19 | 14.19 | 14.19 |
| Depreciation | 18,291.0 | 17,045.0 | 17,683.0 | 18,055.0 | 15,241.0 | 18,140.0 | 18,271.6 | 18,404.1 | 18,537.7 | 18,672.1 |
| Depreciation, % | 9.77 | 8.79 | 10.8 | 10.21 | 8.06 | 9.53 | 9.53 | 9.53 | 9.53 | 9.53 |
| EBIT | 18,962.0 | -35,754.0 | 16,249.0 | 18,818.0 | 20,958.0 | 8,885.5 | 8,949.9 | 9,014.8 | 9,080.2 | 9,146.1 |
| EBIT, % | 10.13 | -18.45 | 9.93 | 10.64 | 11.09 | 4.67 | 4.67 | 4.67 | 4.67 | 4.67 |
| Total Cash | 54,269.0 | 47,863.0 | 33,255.0 | 26,535.0 | 38,785.0 | 41,703.5 | 42,006.0 | 42,310.7 | 42,617.7 | 42,926.9 |
| Total Cash, percent | .0 | .0 | .0 | .0 | .0 | .0 | .0 | .0 | .0 | .0 |
| Account Receivables | 70,107.0 | 65,059.0 | 67,007.0 | 57,205.0 | 48,879.0 | 64,791.2 | 65,261.3 | 65,734.7 | 66,211.6 | 66,691.9 |
| Account Receivables, % | 37.45 | 33.57 | 40.93 | 32.34 | 25.86 | 34.03 | 34.03 | 34.03 | 34.03 | 34.03 |
| Inventories | 79,120.0 | 85,853.0 | 101,805.0 | 100,002.0 | 109,867.0 | 100,304.7 | 101,032.4 | 101,765.3 | 102,503.6 | 103,247.2 |
| Inventories, % | 42.26 | 44.3 | 62.19 | 56.54 | 58.12 | 52.68 | 52.68 | 52.68 | 52.68 | 52.68 |
| Accounts Payable | 27,545.0 | 50,912.0 | 52,815.0 | 45,622.0 | 50,777.0 | 47,942.2 | 48,290.0 | 48,640.3 | 48,993.2 | 49,348.6 |
| Accounts Payable, % | 14.71 | 26.27 | 32.26 | 25.8 | 26.86 | 25.18 | 25.18 | 25.18 | 25.18 | 25.18 |
| Capital Expenditure | -21,124.0 | -23,344.0 | -27,141.0 | -24,649.0 | -20,567.0 | -24,646.5 | -24,825.3 | -25,005.4 | -25,186.8 | -25,369.5 |
| Capital Expenditure, % | -11.28 | -12.04 | -16.58 | -13.94 | -10.88 | -12.94 | -12.94 | -12.94 | -12.94 | -12.94 |
| Tax Rate, % | -15.16 | -15.16 | -15.16 | -15.16 | -15.16 | -15.16 | -15.16 | -15.16 | -15.16 | -15.16 |
| EBITAT | 12,675.6 | -27,909.9 | 12,985.9 | 14,112.0 | 24,134.5 | 7,105.1 | 7,156.7 | 7,208.6 | 7,260.9 | 7,313.6 |
| Depreciation | ||||||||||
| Changes in Account Receivables | ||||||||||
| Changes in Inventories | ||||||||||
| Changes in Accounts Payable | ||||||||||
| Capital Expenditure | ||||||||||
| UFCF | -111,839.4 | -12,526.9 | -12,469.1 | 11,930.0 | 22,424.5 | -8,586.1 | -246.9 | -248.7 | -250.5 | -252.3 |
| WACC, % | 4.03 | 4.15 | 4.17 | 4.12 | 4.38 | 4.17 | 4.17 | 4.17 | 4.17 | 4.17 |
| PV UFCF | ||||||||||
| SUM PV UFCF | -9,108.0 | |||||||||
| Long Term Growth Rate, % | 1.00 | |||||||||
| Free cash flow (T + 1) | -255 | |||||||||
| Terminal Value | -8,032 | |||||||||
| Present Terminal Value | -6,547 | |||||||||
| Enterprise Value | -15,655 | |||||||||
| Net Debt | 52,554 | |||||||||
| Equity Value | -68,209 | |||||||||
| Diluted Shares Outstanding, MM | 124 | |||||||||
| Equity Value Per Share | -548.48 |
What You Will Receive
- Pre-Filled Financial Model: Utilize Sawai Group Holdings Co., Ltd.’s actual data for accurate DCF valuation.
- Comprehensive Forecast Control: Modify revenue growth, profit margins, WACC, and other essential parameters.
- Real-Time Calculations: Automatic updates allow you to view results instantly as adjustments are made.
- Investor-Ready Template: A polished Excel file crafted for top-tier valuation.
- Customizable and Reusable: Designed for flexibility, enabling repeated use for in-depth forecasts.
Key Features
- 🔍 Real-Life (4887T) Financials: Pre-filled historical and projected data for Sawai Group Holdings Co., Ltd.
- ✏️ Fully Customizable Inputs: Adjust all critical parameters (yellow cells) such as WACC, growth %, and tax rates.
- 📊 Professional DCF Valuation: Built-in formulas assess Sawai’s intrinsic value employing the Discounted Cash Flow method.
- ⚡ Instant Results: Visualize Sawai’s valuation instantly following any adjustments.
- Scenario Analysis: Evaluate and compare results for various financial assumptions side-by-side.
How It Works
- Step 1: Download the Excel file for Sawai Group Holdings Co., Ltd. (4887T).
- Step 2: Examine the pre-filled financial data and forecasts for Sawai Group.
- Step 3: Adjust key inputs such as revenue growth, WACC, and tax rates (highlighted cells).
- Step 4: Observe the DCF model refresh in real-time as you modify your assumptions.
- Step 5: Review the outputs and leverage the findings for informed investment decisions.
Why Choose the Sawai Group Holdings Calculator?
- Time-Efficient: Skip the hassle of building a DCF model from scratch – it’s ready for immediate use.
- Enhanced Accuracy: Dependable financial data and formulas significantly minimize valuation errors.
- Completely Customizable: Adjust the model to align with your unique assumptions and forecasts.
- User-Friendly: Intuitive charts and outputs simplify the analysis of results.
- Endorsed by Professionals: Crafted for experts who prioritize precision and ease of use.
Who Should Use This Product?
- Individual Investors: Gain insights to make informed decisions about trading Sawai Group Holdings Co., Ltd. (4887T).
- Financial Analysts: Enhance your valuation processes with readily available financial models tailored for Sawai Group Holdings Co., Ltd. (4887T).
- Consultants: Provide swift and precise valuation insights for clients utilizing Sawai Group Holdings Co., Ltd. (4887T) data.
- Business Owners: Learn how major companies like Sawai Group Holdings Co., Ltd. (4887T) are valued to inform your business strategy.
- Finance Students: Acquire practical knowledge of valuation techniques using real-world examples from Sawai Group Holdings Co., Ltd. (4887T).
Contents of the Template
- Preloaded 4887T Data: Historical and projected financial metrics, including revenue, EBIT, and capital expenditures.
- DCF and WACC Models: Advanced spreadsheets for determining intrinsic value and Weighted Average Cost of Capital.
- Editable Inputs: Cells highlighted in yellow for modifying revenue growth, tax rates, and discount rates.
- Financial Statements: Detailed annual and quarterly financial reports for in-depth analysis.
- Key Ratios: Important profitability, leverage, and efficiency ratios to assess performance.
- Dashboard and Charts: Visual representations of valuation results and underlying assumptions.
Disclaimer
All information, articles, and product details provided on this website are for general informational and educational purposes only. We do not claim any ownership over, nor do we intend to infringe upon, any trademarks, copyrights, logos, brand names, or other intellectual property mentioned or depicted on this site. Such intellectual property remains the property of its respective owners, and any references here are made solely for identification or informational purposes, without implying any affiliation, endorsement, or partnership.
We make no representations or warranties, express or implied, regarding the accuracy, completeness, or suitability of any content or products presented. Nothing on this website should be construed as legal, tax, investment, financial, medical, or other professional advice. In addition, no part of this site—including articles or product references—constitutes a solicitation, recommendation, endorsement, advertisement, or offer to buy or sell any securities, franchises, or other financial instruments, particularly in jurisdictions where such activity would be unlawful.
All content is of a general nature and may not address the specific circumstances of any individual or entity. It is not a substitute for professional advice or services. Any actions you take based on the information provided here are strictly at your own risk. You accept full responsibility for any decisions or outcomes arising from your use of this website and agree to release us from any liability in connection with your use of, or reliance upon, the content or products found herein.