
|
Valoración de DCF Limited Company, Limited (4911.T) |
Completamente Editable: Adáptelo A Sus Necesidades En Excel O Sheets
Diseño Profesional: Plantillas Confiables Y Estándares De La Industria
Predeterminadas Para Un Uso Rápido Y Eficiente
Compatible con MAC / PC, completamente desbloqueado
No Se Necesita Experiencia; Fáciles De Seguir
Shiseido Company, Limited (4911.T) Bundle
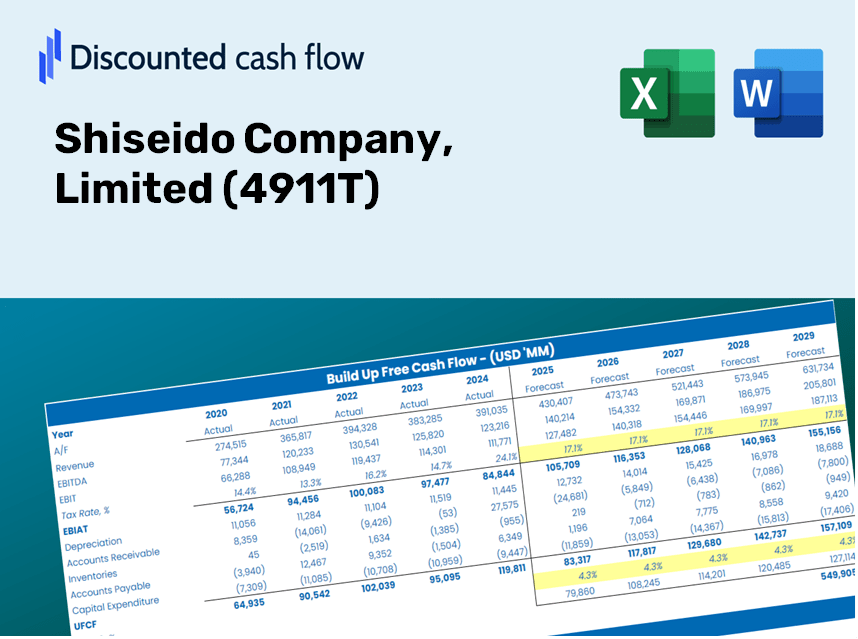
¡Simplifique la valuación de Shiseido Company, Limited (4911t) con esta calculadora DCF personalizable! Con las finanzas shiseido reales y las entradas de pronóstico ajustables, puede probar escenarios y descubrir el valor razonable de Shiseido en minutos.
What You Will Receive
- Pre-Loaded Financial Model: Shiseido’s actual data allows for accurate DCF valuations.
- Comprehensive Forecast Management: Modify revenue growth, profit margins, WACC, and other essential factors.
- Real-Time Calculations: Automatic updates provide immediate results as you adjust parameters.
- Investor-Ready Format: A polished Excel template crafted for high-quality valuation presentations.
- Flexible and Reusable: Designed for adaptability, enabling ongoing use for detailed financial forecasts.
Key Features
- Comprehensive Historical Data: Loaded with Shiseido's past financial performance and future projections.
- Customizable Variables: Modify growth rates, profit margins, discount rates, tax percentages, and capital investments.
- Responsive Valuation Model: Automatically recalculates Net Present Value (NPV) and intrinsic value based on your adjustments.
- Scenario Analysis: Develop various forecasting scenarios to explore different valuation possibilities.
- Intuitive User Interface: Designed to be straightforward and accessible for both industry experts and novices.
How It Functions
- Download: Obtain the pre-prepared Excel file featuring Shiseido's financial information.
- Customize: Modify projections such as revenue growth, EBITDA percentage, and WACC.
- Update Automatically: Intrinsic value and NPV calculations refresh in real-time.
- Test Scenarios: Develop various forecasts and instantly compare their outcomes.
- Make Decisions: Leverage the valuation results to inform your investment approach.
Why Choose This Calculator for Shiseido Company, Limited (4911T)?
- User-Friendly Interface: Tailored for both novices and seasoned users.
- Customizable Inputs: Adjust parameters effortlessly to suit your analysis needs.
- Real-Time Feedback: Instantly view changes in Shiseido's valuation as you modify inputs.
- Pre-Loaded Data: Comes equipped with Shiseido’s actual financial information for swift analysis.
- Relied Upon by Experts: A valuable resource for investors and analysts making strategic decisions.
Who Can Benefit from This Product?
- Investors: Evaluate Shiseido's valuation prior to making stock transactions.
- CFOs and Financial Analysts: Optimize valuation workflows and assess financial forecasts.
- Startup Founders: Gain insights into the valuation methods of leading public companies like Shiseido (4911T).
- Consultants: Produce comprehensive valuation reports for your clients.
- Students and Educators: Utilize current data to practice and instruct on valuation methodologies.
Contents of the Template
- Pre-Filled DCF Model: Shiseido’s financial data preloaded for immediate application.
- WACC Calculator: Comprehensive calculations for the Weighted Average Cost of Capital.
- Financial Ratios: Assess Shiseido's profitability, leverage, and operational efficiency.
- Editable Inputs: Modify assumptions like growth rates, margins, and CAPEX to suit your analysis.
- Financial Statements: Access annual and quarterly reports for in-depth analysis.
- Interactive Dashboard: Effortlessly visualize essential valuation metrics and outcomes.
Disclaimer
All information, articles, and product details provided on this website are for general informational and educational purposes only. We do not claim any ownership over, nor do we intend to infringe upon, any trademarks, copyrights, logos, brand names, or other intellectual property mentioned or depicted on this site. Such intellectual property remains the property of its respective owners, and any references here are made solely for identification or informational purposes, without implying any affiliation, endorsement, or partnership.
We make no representations or warranties, express or implied, regarding the accuracy, completeness, or suitability of any content or products presented. Nothing on this website should be construed as legal, tax, investment, financial, medical, or other professional advice. In addition, no part of this site—including articles or product references—constitutes a solicitation, recommendation, endorsement, advertisement, or offer to buy or sell any securities, franchises, or other financial instruments, particularly in jurisdictions where such activity would be unlawful.
All content is of a general nature and may not address the specific circumstances of any individual or entity. It is not a substitute for professional advice or services. Any actions you take based on the information provided here are strictly at your own risk. You accept full responsibility for any decisions or outcomes arising from your use of this website and agree to release us from any liability in connection with your use of, or reliance upon, the content or products found herein.