
|
T. Hasegawa Co., Ltd. (4958.T) Valoración de DCF |
Completamente Editable: Adáptelo A Sus Necesidades En Excel O Sheets
Diseño Profesional: Plantillas Confiables Y Estándares De La Industria
Predeterminadas Para Un Uso Rápido Y Eficiente
Compatible con MAC / PC, completamente desbloqueado
No Se Necesita Experiencia; Fáciles De Seguir
T. Hasegawa Co., Ltd. (4958.T) Bundle
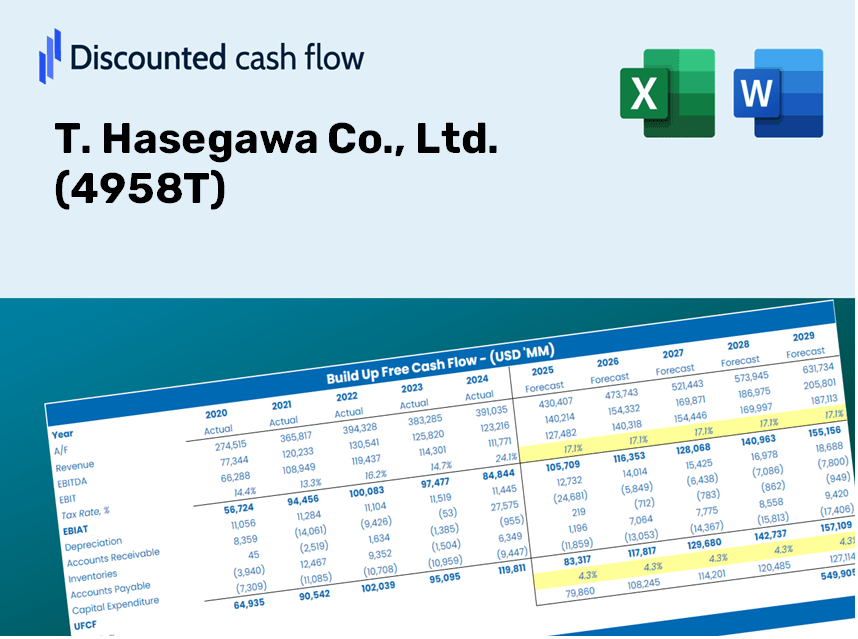
¡Obtenga información sobre su análisis de valoración de T. Hasegawa Co., Ltd. (4958t) con nuestra calculadora DCF de vanguardia! Esta plantilla de Excel viene precargada con datos reales de 4958T, lo que le permite ajustar los pronósticos y supuestos para determinar con precisión el valor intrínseco de T. Hasegawa Co., Ltd.
Discounted Cash Flow (DCF) - (USD MM)
| Year | AY1 2020 |
AY2 2021 |
AY3 2022 |
AY4 2023 |
AY5 2024 |
FY1 2025 |
FY2 2026 |
FY3 2027 |
FY4 2028 |
FY5 2029 |
|---|---|---|---|---|---|---|---|---|---|---|
| Revenue | 50,192.0 | 55,755.0 | 62,398.0 | 64,874.0 | 71,645.0 | 72,842.9 | 74,060.9 | 75,299.2 | 76,558.2 | 77,838.3 |
| Revenue Growth, % | 0 | 11.08 | 11.91 | 3.97 | 10.44 | 1.67 | 1.67 | 1.67 | 1.67 | 1.67 |
| EBITDA | 10,034.0 | 13,458.0 | 15,504.0 | 12,120.0 | 15,214.0 | 15,864.2 | 16,129.5 | 16,399.2 | 16,673.4 | 16,952.2 |
| EBITDA, % | 19.99 | 24.14 | 24.85 | 18.68 | 21.24 | 21.78 | 21.78 | 21.78 | 21.78 | 21.78 |
| Depreciation | 3,003.0 | 3,758.0 | 4,230.0 | 4,612.0 | 5,020.0 | 4,897.7 | 4,979.6 | 5,062.8 | 5,147.5 | 5,233.6 |
| Depreciation, % | 5.98 | 6.74 | 6.78 | 7.11 | 7.01 | 6.72 | 6.72 | 6.72 | 6.72 | 6.72 |
| EBIT | 7,031.0 | 9,700.0 | 11,274.0 | 7,508.0 | 10,194.0 | 10,966.5 | 11,149.9 | 11,336.3 | 11,525.9 | 11,718.6 |
| EBIT, % | 14.01 | 17.4 | 18.07 | 11.57 | 14.23 | 15.06 | 15.06 | 15.06 | 15.06 | 15.06 |
| Total Cash | 28,584.0 | 23,036.0 | 29,350.0 | 32,699.0 | 34,393.0 | 35,505.3 | 36,098.9 | 36,702.5 | 37,316.2 | 37,940.1 |
| Total Cash, percent | .0 | .0 | .0 | .0 | .0 | .0 | .0 | .0 | .0 | .0 |
| Account Receivables | 15,458.0 | 17,046.0 | 18,695.0 | 19,863.0 | 20,472.0 | 21,929.2 | 22,295.8 | 22,668.6 | 23,047.6 | 23,433.0 |
| Account Receivables, % | 30.8 | 30.57 | 29.96 | 30.62 | 28.57 | 30.1 | 30.1 | 30.1 | 30.1 | 30.1 |
| Inventories | 14,232.0 | 14,080.0 | 16,841.0 | 16,849.0 | 16,414.0 | 18,863.4 | 19,178.8 | 19,499.5 | 19,825.5 | 20,157.0 |
| Inventories, % | 28.36 | 25.25 | 26.99 | 25.97 | 22.91 | 25.9 | 25.9 | 25.9 | 25.9 | 25.9 |
| Accounts Payable | 4,743.0 | 5,000.0 | 6,211.0 | 5,425.0 | 6,324.0 | 6,637.5 | 6,748.5 | 6,861.3 | 6,976.1 | 7,092.7 |
| Accounts Payable, % | 9.45 | 8.97 | 9.95 | 8.36 | 8.83 | 9.11 | 9.11 | 9.11 | 9.11 | 9.11 |
| Capital Expenditure | -3,288.0 | -2,764.0 | -4,141.0 | -3,548.0 | -3,976.0 | -4,248.7 | -4,319.7 | -4,391.9 | -4,465.4 | -4,540.0 |
| Capital Expenditure, % | -6.55 | -4.96 | -6.64 | -5.47 | -5.55 | -5.83 | -5.83 | -5.83 | -5.83 | -5.83 |
| Tax Rate, % | 29.19 | 29.19 | 29.19 | 29.19 | 29.19 | 29.19 | 29.19 | 29.19 | 29.19 | 29.19 |
| EBITAT | 5,092.2 | 6,768.6 | 8,012.0 | 5,372.9 | 7,218.0 | 7,800.2 | 7,930.7 | 8,063.3 | 8,198.1 | 8,335.2 |
| Depreciation | ||||||||||
| Changes in Account Receivables | ||||||||||
| Changes in Inventories | ||||||||||
| Changes in Accounts Payable | ||||||||||
| Capital Expenditure | ||||||||||
| UFCF | -20,139.8 | 6,583.6 | 4,902.0 | 4,474.9 | 8,987.0 | 4,856.2 | 8,019.5 | 8,153.5 | 8,289.9 | 8,428.5 |
| WACC, % | 4.64 | 4.64 | 4.64 | 4.64 | 4.64 | 4.64 | 4.64 | 4.64 | 4.64 | 4.64 |
| PV UFCF | ||||||||||
| SUM PV UFCF | 32,713.6 | |||||||||
| Long Term Growth Rate, % | 3.50 | |||||||||
| Free cash flow (T + 1) | 8,723 | |||||||||
| Terminal Value | 765,048 | |||||||||
| Present Terminal Value | 609,810 | |||||||||
| Enterprise Value | 642,524 | |||||||||
| Net Debt | -27,396 | |||||||||
| Equity Value | 669,920 | |||||||||
| Diluted Shares Outstanding, MM | 41 | |||||||||
| Equity Value Per Share | 16,212.58 |
Benefits of Choosing T. Hasegawa Co., Ltd. (4958T)
- Comprehensive Financial Model: Utilize T. Hasegawa's actual data for accurate DCF valuation.
- Complete Forecast Flexibility: Modify revenue growth, profit margins, WACC, and other key parameters as needed.
- Real-Time Calculations: Immediate updates provide instant results as you adjust inputs.
- Professional-Grade Template: A polished Excel file crafted for high-quality valuation analyses.
- Adaptable and Reusable: Designed for easy customization, suitable for multiple detailed forecasting sessions.
Key Features
- 🔍 Real-Life T. Hasegawa Financials: Pre-filled historical and projected data for T. Hasegawa Co., Ltd. (4958T).
- ✏️ Fully Customizable Inputs: Modify all essential parameters (yellow cells) such as WACC, growth %, and tax rates.
- 📊 Professional DCF Valuation: Integrated formulas calculate T. Hasegawa's intrinsic value using the Discounted Cash Flow method.
- ⚡ Instant Results: View T. Hasegawa's valuation immediately after adjustments are made.
- Scenario Analysis: Evaluate and contrast results for different financial assumptions side-by-side.
How It Operates
- Step 1: Download the Excel template.
- Step 2: Examine T. Hasegawa Co., Ltd.'s pre-populated financial information and projections.
- Step 3: Adjust key variables such as revenue growth, WACC, and tax rates (cells highlighted for easy identification).
- Step 4: Observe the DCF model refresh in real-time as you modify your assumptions.
- Step 5: Review the results and leverage the insights for your investment decisions.
Why Choose T. Hasegawa Co., Ltd. (4958T) Calculator?
- Precise Data: Utilize authentic T. Hasegawa Co., Ltd. financials for trustworthy valuation results.
- Tailorable: Modify essential parameters such as growth rates, WACC, and tax rates to align with your forecasts.
- Efficiency Boosting: Ready-made calculations save you time and effort, eliminating the need to start from the ground up.
- High-Quality Tool: Crafted for investors, analysts, and consultants looking for professional-grade resources.
- Easy to Use: User-friendly design and clear, guided instructions ensure accessibility for everyone.
Who Can Benefit from T. Hasegawa Co., Ltd. (4958T)?
- Investors: Make informed choices utilizing a sophisticated valuation tool tailored for your needs.
- Financial Analysts: Streamline your workflow with a customizable DCF model designed for efficiency.
- Consultants: Effortlessly modify the template for presentations or reports tailored to your clients.
- Finance Enthusiasts: Enhance your knowledge of valuation methods through practical, real-world case studies.
- Educators and Students: Employ it as a hands-on resource in finance courses to facilitate learning.
Contents of the Template
- Pre-Filled DCF Model: T. Hasegawa Co., Ltd.'s financial data readily available for immediate analysis.
- WACC Calculator: Comprehensive calculations for the Weighted Average Cost of Capital.
- Financial Ratios: Assess T. Hasegawa's profitability, leverage, and operational efficiency.
- Editable Inputs: Adjust assumptions such as growth rates, profit margins, and capital expenditures to match your scenarios.
- Financial Statements: Access to annual and quarterly reports for thorough examination.
- Interactive Dashboard: Visually explore essential valuation metrics and outcomes with ease.
Disclaimer
All information, articles, and product details provided on this website are for general informational and educational purposes only. We do not claim any ownership over, nor do we intend to infringe upon, any trademarks, copyrights, logos, brand names, or other intellectual property mentioned or depicted on this site. Such intellectual property remains the property of its respective owners, and any references here are made solely for identification or informational purposes, without implying any affiliation, endorsement, or partnership.
We make no representations or warranties, express or implied, regarding the accuracy, completeness, or suitability of any content or products presented. Nothing on this website should be construed as legal, tax, investment, financial, medical, or other professional advice. In addition, no part of this site—including articles or product references—constitutes a solicitation, recommendation, endorsement, advertisement, or offer to buy or sell any securities, franchises, or other financial instruments, particularly in jurisdictions where such activity would be unlawful.
All content is of a general nature and may not address the specific circumstances of any individual or entity. It is not a substitute for professional advice or services. Any actions you take based on the information provided here are strictly at your own risk. You accept full responsibility for any decisions or outcomes arising from your use of this website and agree to release us from any liability in connection with your use of, or reliance upon, the content or products found herein.