
|
Infroneer Holdings Inc. (5076.T) Valoración de DCF |
Completamente Editable: Adáptelo A Sus Necesidades En Excel O Sheets
Diseño Profesional: Plantillas Confiables Y Estándares De La Industria
Predeterminadas Para Un Uso Rápido Y Eficiente
Compatible con MAC / PC, completamente desbloqueado
No Se Necesita Experiencia; Fáciles De Seguir
INFRONEER Holdings Inc. (5076.T) Bundle
¡Evalúe la perspectiva financiera de Infroneer Holdings Inc. como un experto! Esta calculadora DCF (5076T) viene con finanzas preactadas y ofrece una flexibilidad total para modificar el crecimiento de los ingresos, WACC, los márgenes y otros supuestos esenciales para alinearse con sus proyecciones.
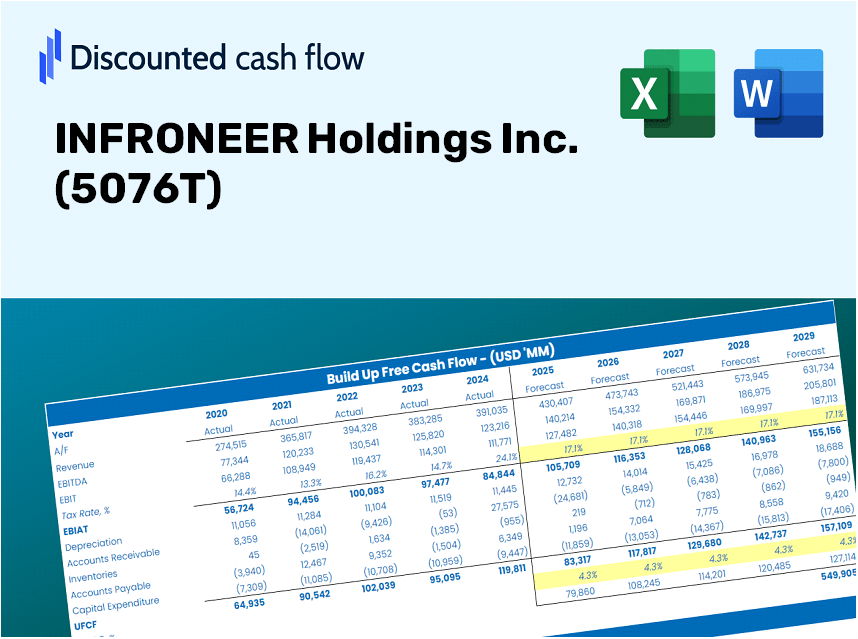
Discounted Cash Flow (DCF) - (USD MM)
| Year | AY1 2020 |
AY2 2021 |
AY3 2022 |
AY4 2023 |
AY5 2024 |
FY1 2025 |
FY2 2026 |
FY3 2027 |
FY4 2028 |
FY5 2029 |
|---|---|---|---|---|---|---|---|---|---|---|
| Revenue | 678,059.0 | 682,912.0 | 709,640.0 | 793,264.0 | 847,548.0 | 920,697.3 | 1,000,159.9 | 1,086,480.7 | 1,180,251.6 | 1,282,115.5 |
| Revenue Growth, % | 0 | 0.71572 | 3.91 | 11.78 | 6.84 | 8.63 | 8.63 | 8.63 | 8.63 | 8.63 |
| EBITDA | 82,957.0 | 69,128.0 | 80,329.0 | 87,653.0 | 92,966.0 | 102,556.8 | 111,408.2 | 121,023.5 | 131,468.6 | 142,815.3 |
| EBITDA, % | 12.23 | 10.12 | 11.32 | 11.05 | 10.97 | 11.14 | 11.14 | 11.14 | 11.14 | 11.14 |
| Depreciation | 31,193.0 | 31,638.0 | 34,062.0 | 33,549.0 | 35,318.0 | 41,301.3 | 44,865.9 | 48,738.1 | 52,944.6 | 57,514.1 |
| Depreciation, % | 4.6 | 4.63 | 4.8 | 4.23 | 4.17 | 4.49 | 4.49 | 4.49 | 4.49 | 4.49 |
| EBIT | 51,764.0 | 37,490.0 | 46,267.0 | 54,104.0 | 57,648.0 | 61,255.5 | 66,542.3 | 72,285.3 | 78,524.1 | 85,301.3 |
| EBIT, % | 7.63 | 5.49 | 6.52 | 6.82 | 6.8 | 6.65 | 6.65 | 6.65 | 6.65 | 6.65 |
| Total Cash | 100,717.0 | 78,065.0 | 88,830.0 | 113,421.0 | 119,502.0 | 123,742.2 | 134,422.0 | 146,023.6 | 158,626.5 | 172,317.0 |
| Total Cash, percent | .0 | .0 | .0 | .0 | .0 | .0 | .0 | .0 | .0 | .0 |
| Account Receivables | 263,277.0 | 310,684.0 | 295,948.0 | 145,514.0 | 380,896.0 | 348,595.6 | 378,681.8 | 411,364.7 | 446,868.4 | 485,436.2 |
| Account Receivables, % | 38.83 | 45.49 | 41.7 | 18.34 | 44.94 | 37.86 | 37.86 | 37.86 | 37.86 | 37.86 |
| Inventories | 25,299.0 | 20,702.0 | 9,747.0 | 12,575.0 | 12,810.0 | 20,683.8 | 22,468.9 | 24,408.2 | 26,514.8 | 28,803.2 |
| Inventories, % | 3.73 | 3.03 | 1.37 | 1.59 | 1.51 | 2.25 | 2.25 | 2.25 | 2.25 | 2.25 |
| Accounts Payable | 117,754.0 | 117,900.0 | 131,640.0 | 273,792.0 | 272,222.0 | 220,625.4 | 239,666.9 | 260,351.8 | 282,822.0 | 307,231.5 |
| Accounts Payable, % | 17.37 | 17.26 | 18.55 | 34.51 | 32.12 | 23.96 | 23.96 | 23.96 | 23.96 | 23.96 |
| Capital Expenditure | -25,771.0 | -21,698.0 | -20,043.0 | -44,564.0 | -37,855.0 | -36,619.0 | -39,779.5 | -43,212.8 | -46,942.3 | -50,993.8 |
| Capital Expenditure, % | -3.8 | -3.18 | -2.82 | -5.62 | -4.47 | -3.98 | -3.98 | -3.98 | -3.98 | -3.98 |
| Tax Rate, % | 34.85 | 34.85 | 34.85 | 34.85 | 34.85 | 34.85 | 34.85 | 34.85 | 34.85 | 34.85 |
| EBITAT | 24,815.3 | 22,472.6 | 34,630.7 | 35,644.4 | 37,557.6 | 38,439.4 | 41,757.0 | 45,360.9 | 49,275.9 | 53,528.8 |
| Depreciation | ||||||||||
| Changes in Account Receivables | ||||||||||
| Changes in Inventories | ||||||||||
| Changes in Accounts Payable | ||||||||||
| Capital Expenditure | ||||||||||
| UFCF | -140,584.7 | -10,251.4 | 88,080.7 | 314,387.4 | -202,166.4 | 15,951.7 | 34,013.5 | 36,949.1 | 40,138.1 | 43,602.3 |
| WACC, % | 3.2 | 3.4 | 3.66 | 3.5 | 3.49 | 3.45 | 3.45 | 3.45 | 3.45 | 3.45 |
| PV UFCF | ||||||||||
| SUM PV UFCF | 152,423.6 | |||||||||
| Long Term Growth Rate, % | 2.00 | |||||||||
| Free cash flow (T + 1) | 44,474 | |||||||||
| Terminal Value | 3,067,439 | |||||||||
| Present Terminal Value | 2,588,963 | |||||||||
| Enterprise Value | 2,741,387 | |||||||||
| Net Debt | 299,180 | |||||||||
| Equity Value | 2,442,207 | |||||||||
| Diluted Shares Outstanding, MM | 279 | |||||||||
| Equity Value Per Share | 8,742.87 |
Benefits You Will Receive
- Pre-Loaded Financial Model: Utilizing INFRONEER Holdings Inc.'s (5076T) actual data for accurate DCF valuation.
- Comprehensive Forecast Control: Modify revenue growth, profit margins, WACC, and other essential variables.
- Real-Time Calculations: Automatic updates allow you to see results instantly as you make adjustments.
- Professional-Quality Template: A polished Excel file crafted for high-standard valuation needs.
- Versatile and Reusable: Designed for adaptability, enabling repeated applications for in-depth forecasting.
Key Features
- Comprehensive INFRONEER Data: Pre-loaded with historical financials and future projections for INFRONEER Holdings Inc. (5076T).
- Customizable Parameters: Modify inputs such as revenue growth, profit margins, WACC, tax rates, and capital expenditures.
- Dynamic Valuation Framework: Automatic recalculations of Net Present Value (NPV) and intrinsic value based on user adjustments.
- Scenario Analysis: Develop various forecast scenarios to explore different valuation possibilities.
- User-Centric Interface: Designed to be intuitive and accessible for both professionals and newcomers.
How It Functions
- Step 1: Download the Excel spreadsheet.
- Step 2: Analyze the pre-filled data on INFRONEER Holdings Inc. (5076T) (historical and projected).
- Step 3: Modify key assumptions (highlighted in yellow) according to your findings.
- Step 4: Observe the automatic recalculations for INFRONEER Holdings Inc.'s intrinsic value.
- Step 5: Utilize the results for your investment choices or reporting needs.
Why Choose INFRONEER Holdings Inc. (5076T) Calculator?
- User-Friendly Interface: Tailored for both novices and seasoned professionals.
- Customizable Parameters: Easily adjust inputs to suit your specific analysis needs.
- Real-Time Adjustments: Observe immediate updates to INFRONEER's valuation as you modify inputs.
- Preloaded Data: Comes equipped with INFRONEER's actual financial information for swift evaluations.
- Relied Upon by Professionals: Utilized by investors and analysts for making informed choices.
Who Can Benefit from INFRONEER Holdings Inc. (5076T)?
- Professional Investors: Develop comprehensive and trustworthy valuation models for portfolio management.
- Corporate Finance Teams: Evaluate valuation scenarios to inform and shape internal strategies.
- Consultants and Advisors: Deliver precise valuation insights to clients regarding INFRONEER Holdings Inc. (5076T).
- Students and Educators: Utilize actual market data to learn and teach financial modeling techniques.
- Tech Enthusiasts: Gain insights into how technology companies like INFRONEER Holdings Inc. (5076T) are assessed in the market.
What the Template Includes
- Operating and Balance Sheet Data: Pre-filled historical data and forecasts for INFRONEER Holdings Inc. (5076T), covering revenue, EBITDA, EBIT, and capital expenditures.
- WACC Calculation: A dedicated worksheet for calculating the Weighted Average Cost of Capital (WACC), featuring parameters such as Beta, risk-free rate, and share price.
- DCF Valuation (Unlevered and Levered): Customizable Discounted Cash Flow models demonstrating intrinsic value along with thorough calculations.
- Financial Statements: Pre-loaded financial statements (both annual and quarterly) to facilitate comprehensive analysis.
- Key Ratios: Contains profitability, leverage, and efficiency ratios specific to INFRONEER Holdings Inc. (5076T).
- Dashboard and Charts: A visual overview of valuation outputs and assumptions for straightforward result analysis.
Disclaimer
All information, articles, and product details provided on this website are for general informational and educational purposes only. We do not claim any ownership over, nor do we intend to infringe upon, any trademarks, copyrights, logos, brand names, or other intellectual property mentioned or depicted on this site. Such intellectual property remains the property of its respective owners, and any references here are made solely for identification or informational purposes, without implying any affiliation, endorsement, or partnership.
We make no representations or warranties, express or implied, regarding the accuracy, completeness, or suitability of any content or products presented. Nothing on this website should be construed as legal, tax, investment, financial, medical, or other professional advice. In addition, no part of this site—including articles or product references—constitutes a solicitation, recommendation, endorsement, advertisement, or offer to buy or sell any securities, franchises, or other financial instruments, particularly in jurisdictions where such activity would be unlawful.
All content is of a general nature and may not address the specific circumstances of any individual or entity. It is not a substitute for professional advice or services. Any actions you take based on the information provided here are strictly at your own risk. You accept full responsibility for any decisions or outcomes arising from your use of this website and agree to release us from any liability in connection with your use of, or reliance upon, the content or products found herein.