
|
Maruwa Co., Ltd. (5344.t) Valoración de DCF |
Completamente Editable: Adáptelo A Sus Necesidades En Excel O Sheets
Diseño Profesional: Plantillas Confiables Y Estándares De La Industria
Predeterminadas Para Un Uso Rápido Y Eficiente
Compatible con MAC / PC, completamente desbloqueado
No Se Necesita Experiencia; Fáciles De Seguir
Maruwa Co., Ltd. (5344.T) Bundle
¡Descubra el verdadero valor de Maruwa Co., Ltd. (5344t) con nuestra calculadora DCF avanzada! Ajuste los supuestos clave, explore varios escenarios y evalúe cómo los diferentes cambios afectan la valoración de Maruwa Co., Ltd. (5344T), todo dentro de una plantilla de Excel fácil de usar.
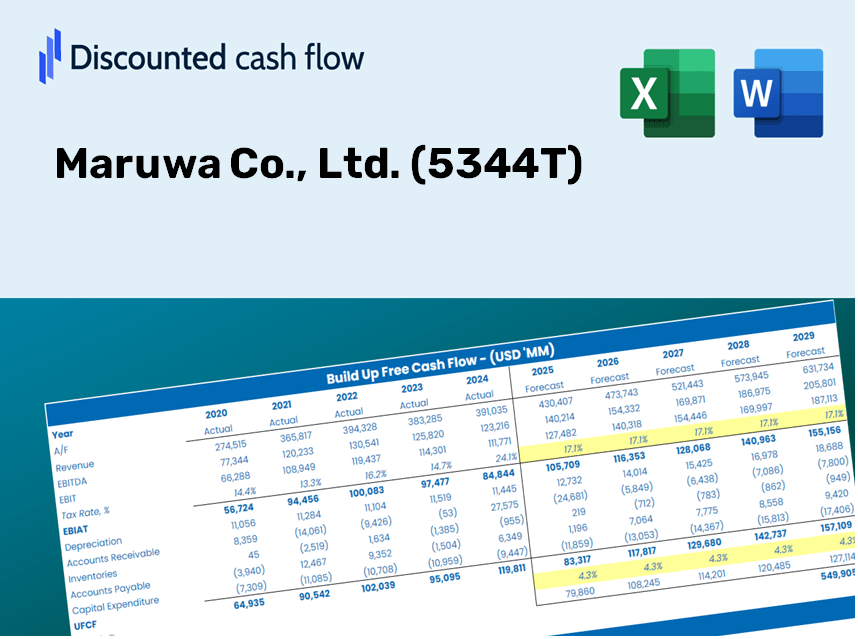
Discounted Cash Flow (DCF) - (USD MM)
| Year | AY1 2020 |
AY2 2021 |
AY3 2022 |
AY4 2023 |
AY5 2024 |
FY1 2025 |
FY2 2026 |
FY3 2027 |
FY4 2028 |
FY5 2029 |
|---|---|---|---|---|---|---|---|---|---|---|
| Revenue | 41,438.0 | 54,344.0 | 58,804.0 | 61,564.0 | 71,849.0 | 82,761.4 | 95,331.2 | 109,810.1 | 126,488.1 | 145,699.1 |
| Revenue Growth, % | 0 | 31.15 | 8.21 | 4.69 | 16.71 | 15.19 | 15.19 | 15.19 | 15.19 | 15.19 |
| EBITDA | 12,087.1 | 21,908.0 | 23,229.0 | 23,940.0 | 31,852.0 | 31,814.1 | 36,646.0 | 42,211.8 | 48,622.9 | 56,007.7 |
| EBITDA, % | 29.17 | 40.31 | 39.5 | 38.89 | 44.33 | 38.44 | 38.44 | 38.44 | 38.44 | 38.44 |
| Depreciation | 2,195.9 | 2,570.0 | 3,087.0 | 4,138.0 | 4,690.0 | 4,721.9 | 5,439.0 | 6,265.1 | 7,216.7 | 8,312.7 |
| Depreciation, % | 5.3 | 4.73 | 5.25 | 6.72 | 6.53 | 5.71 | 5.71 | 5.71 | 5.71 | 5.71 |
| EBIT | 9,891.3 | 19,338.0 | 20,142.0 | 19,802.0 | 27,162.0 | 27,092.2 | 31,206.9 | 35,946.7 | 41,406.2 | 47,695.0 |
| EBIT, % | 23.87 | 35.58 | 34.25 | 32.16 | 37.8 | 32.74 | 32.74 | 32.74 | 32.74 | 32.74 |
| Total Cash | 34,089.0 | 44,621.0 | 49,795.0 | 55,250.0 | 71,793.0 | 72,618.0 | 83,647.3 | 96,351.6 | 110,985.5 | 127,842.0 |
| Total Cash, percent | .0 | .0 | .0 | .0 | .0 | .0 | .0 | .0 | .0 | .0 |
| Account Receivables | 11,093.9 | 15,150.0 | 12,855.0 | 15,933.0 | 13,816.0 | 20,131.0 | 23,188.5 | 26,710.3 | 30,767.1 | 35,440.0 |
| Account Receivables, % | 26.77 | 27.88 | 21.86 | 25.88 | 19.23 | 24.32 | 24.32 | 24.32 | 24.32 | 24.32 |
| Inventories | 6,383.1 | 7,986.0 | 8,939.0 | 9,783.0 | 11,846.0 | 12,857.6 | 14,810.4 | 17,059.8 | 19,650.9 | 22,635.5 |
| Inventories, % | 15.4 | 14.7 | 15.2 | 15.89 | 16.49 | 15.54 | 15.54 | 15.54 | 15.54 | 15.54 |
| Accounts Payable | 4,336.0 | 5,863.0 | 4,517.0 | 5,312.0 | 3,805.0 | 7,094.0 | 8,171.4 | 9,412.5 | 10,842.1 | 12,488.8 |
| Accounts Payable, % | 10.46 | 10.79 | 7.68 | 8.63 | 5.3 | 8.57 | 8.57 | 8.57 | 8.57 | 8.57 |
| Capital Expenditure | -5,577.6 | -3,808.0 | -8,724.0 | -11,324.0 | -9,986.0 | -11,188.6 | -12,887.9 | -14,845.3 | -17,100.1 | -19,697.2 |
| Capital Expenditure, % | -13.46 | -7.01 | -14.84 | -18.39 | -13.9 | -13.52 | -13.52 | -13.52 | -13.52 | -13.52 |
| Tax Rate, % | 29.15 | 29.15 | 29.15 | 29.15 | 29.15 | 29.15 | 29.15 | 29.15 | 29.15 | 29.15 |
| EBITAT | 6,939.9 | 13,354.8 | 14,294.7 | 14,337.0 | 19,244.1 | 19,151.1 | 22,059.7 | 25,410.2 | 29,269.5 | 33,714.9 |
| Depreciation | ||||||||||
| Changes in Account Receivables | ||||||||||
| Changes in Inventories | ||||||||||
| Changes in Accounts Payable | ||||||||||
| Capital Expenditure | ||||||||||
| UFCF | -9,582.8 | 7,984.8 | 8,653.7 | 4,024.0 | 12,495.1 | 8,646.8 | 10,678.0 | 12,299.8 | 14,167.8 | 16,319.6 |
| WACC, % | 9.36 | 9.36 | 9.36 | 9.36 | 9.36 | 9.36 | 9.36 | 9.36 | 9.36 | 9.36 |
| PV UFCF | ||||||||||
| SUM PV UFCF | 46,580.7 | |||||||||
| Long Term Growth Rate, % | 2.00 | |||||||||
| Free cash flow (T + 1) | 16,646 | |||||||||
| Terminal Value | 226,236 | |||||||||
| Present Terminal Value | 144,648 | |||||||||
| Enterprise Value | 191,229 | |||||||||
| Net Debt | -71,793 | |||||||||
| Equity Value | 263,022 | |||||||||
| Diluted Shares Outstanding, MM | 12 | |||||||||
| Equity Value Per Share | 21,316.29 |
Discover the Benefits
- Authentic Maruwa Financial Data: Pre-loaded with Maruwa’s historical and future performance metrics for in-depth analysis.
- Completely Customizable Template: Easily adjust crucial inputs such as revenue growth, WACC, and EBITDA percentage.
- Instant Calculations: Watch Maruwa’s intrinsic value refresh automatically with your updates.
- Expert Valuation Tool: Crafted for investors, analysts, and consultants aiming for precise DCF outcomes.
- Intuitive Design: Streamlined layout and straightforward instructions suitable for all skill levels.
Key Features
- 🔍 Real-Life MARUWA Financials: Pre-filled historical and projected data for Maruwa Co., Ltd. (5344T).
- ✏️ Fully Customizable Inputs: Modify all essential parameters (yellow cells) such as WACC, growth %, and tax rates.
- 📊 Professional DCF Valuation: Integrated formulas to calculate Maruwa’s intrinsic value using the Discounted Cash Flow method.
- ⚡ Instant Results: View Maruwa’s valuation immediately after making changes.
- Scenario Analysis: Analyze and compare results for different financial assumptions side-by-side.
How It Works
- Step 1: Download the prebuilt Excel template featuring Maruwa Co., Ltd.'s (5344T) data.
- Step 2: Navigate through the pre-filled sheets to familiarize yourself with the key metrics.
- Step 3: Update forecasts and assumptions in the editable yellow cells (WACC, growth rates, margins).
- Step 4: Instantly view the recalibrated results, including Maruwa Co., Ltd.'s (5344T) intrinsic value.
- Step 5: Make well-informed investment choices or create reports based on the outputs.
Why Opt for This Calculator?
- User-Friendly Interface: Perfect for both newcomers and seasoned users.
- Customizable Inputs: Adjust parameters easily to suit your specific analysis.
- Real-Time Feedback: Observe immediate changes in Maruwa Co., Ltd.'s valuation as you modify values.
- Fully Equipped: Comes preloaded with Maruwa's latest financial metrics for swift evaluations.
- Endorsed by Industry Experts: Utilized by investors and analysts for strategic decision-making.
Who Can Benefit from This Product?
- Investors: Effectively determine the fair value of Maruwa Co., Ltd. (5344T) before making investment choices.
- CFOs: Utilize a top-tier DCF model for comprehensive financial reporting and analysis.
- Consultants: Seamlessly customize the template for creating valuation reports tailored to clients.
- Entrepreneurs: Acquire insights into financial modeling practices of leading corporations.
- Educators: Employ it as a resource to illustrate various valuation techniques in the classroom.
Contents of the Template
- Operating and Balance Sheet Data: Pre-populated historical data and forecasts for Maruwa Co., Ltd. (5344T), including figures for revenue, EBITDA, EBIT, and capital expenditures.
- WACC Calculation: A specific sheet dedicated to the Weighted Average Cost of Capital (WACC), detailing parameters such as Beta, risk-free rate, and share price.
- DCF Valuation (Unlevered and Levered): Customizable Discounted Cash Flow models that provide intrinsic value assessments with comprehensive calculations.
- Financial Statements: Pre-loaded annual and quarterly financial statements to facilitate in-depth analysis.
- Key Ratios: A collection of essential profitability, leverage, and efficiency ratios for Maruwa Co., Ltd. (5344T).
- Dashboard and Charts: A visual representation of valuation outputs and underlying assumptions to streamline results analysis.
Disclaimer
All information, articles, and product details provided on this website are for general informational and educational purposes only. We do not claim any ownership over, nor do we intend to infringe upon, any trademarks, copyrights, logos, brand names, or other intellectual property mentioned or depicted on this site. Such intellectual property remains the property of its respective owners, and any references here are made solely for identification or informational purposes, without implying any affiliation, endorsement, or partnership.
We make no representations or warranties, express or implied, regarding the accuracy, completeness, or suitability of any content or products presented. Nothing on this website should be construed as legal, tax, investment, financial, medical, or other professional advice. In addition, no part of this site—including articles or product references—constitutes a solicitation, recommendation, endorsement, advertisement, or offer to buy or sell any securities, franchises, or other financial instruments, particularly in jurisdictions where such activity would be unlawful.
All content is of a general nature and may not address the specific circumstances of any individual or entity. It is not a substitute for professional advice or services. Any actions you take based on the information provided here are strictly at your own risk. You accept full responsibility for any decisions or outcomes arising from your use of this website and agree to release us from any liability in connection with your use of, or reliance upon, the content or products found herein.