
|
Furukawa Electric Co., Ltd. (5801.T) Valoración de DCF |
Completamente Editable: Adáptelo A Sus Necesidades En Excel O Sheets
Diseño Profesional: Plantillas Confiables Y Estándares De La Industria
Predeterminadas Para Un Uso Rápido Y Eficiente
Compatible con MAC / PC, completamente desbloqueado
No Se Necesita Experiencia; Fáciles De Seguir
Furukawa Electric Co., Ltd. (5801.T) Bundle
¡Explore el futuro financiero de Furukawa Electric Co., Ltd. (5801t) con nuestra calculadora DCF fácil de usar! Ingrese sus proyecciones para el crecimiento, los márgenes y los gastos para calcular el valor intrínseco de Furukawa Electric Co., Ltd. (5801t) y dar forma a su estrategia de inversión.
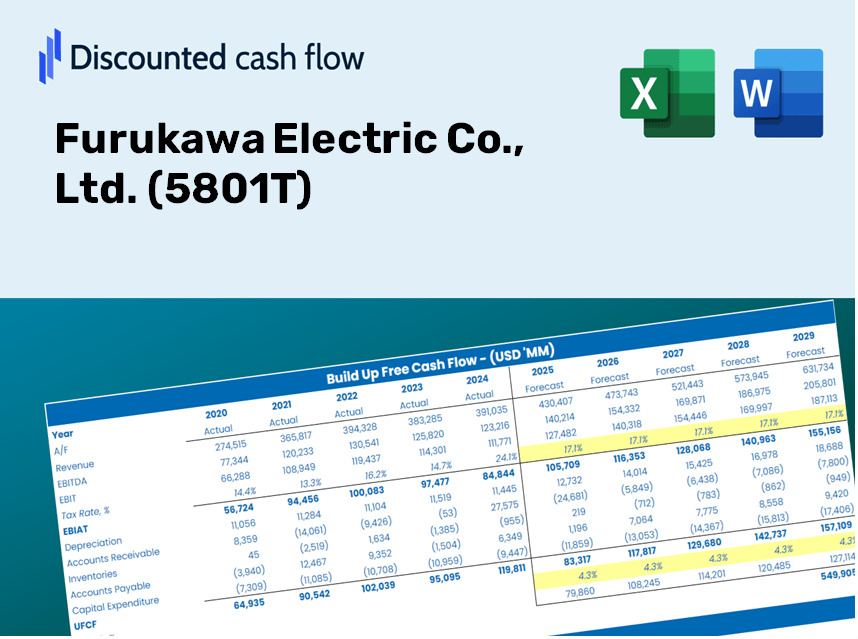
Discounted Cash Flow (DCF) - (USD MM)
| Year | AY1 2021 |
AY2 2022 |
AY3 2023 |
AY4 2024 |
AY5 2025 |
FY1 2026 |
FY2 2027 |
FY3 2028 |
FY4 2029 |
FY5 2030 |
|---|---|---|---|---|---|---|---|---|---|---|
| Revenue | 811,600.0 | 930,496.0 | 1,066,326.0 | 1,056,528.0 | 1,201,762.0 | 1,328,171.3 | 1,467,877.2 | 1,622,278.3 | 1,792,920.4 | 1,981,511.7 |
| Revenue Growth, % | 0 | 14.65 | 14.6 | -0.91886 | 13.75 | 10.52 | 10.52 | 10.52 | 10.52 | 10.52 |
| EBITDA | 57,065.0 | 57,526.0 | 68,253.0 | 68,253.0 | 104,562.0 | 92,374.5 | 102,091.1 | 112,829.7 | 124,697.9 | 137,814.4 |
| EBITDA, % | 7.03 | 6.18 | 6.4 | 6.46 | 8.7 | 6.96 | 6.96 | 6.96 | 6.96 | 6.96 |
| Depreciation | 32,163.0 | 33,721.0 | 38,951.0 | 38,951.0 | 41,251.0 | 48,767.7 | 53,897.4 | 59,566.7 | 65,832.3 | 72,757.0 |
| Depreciation, % | 3.96 | 3.62 | 3.65 | 3.69 | 3.43 | 3.67 | 3.67 | 3.67 | 3.67 | 3.67 |
| EBIT | 24,902.0 | 23,805.0 | 29,302.0 | 29,302.0 | 63,311.0 | 43,606.8 | 48,193.7 | 53,263.0 | 58,865.6 | 65,057.5 |
| EBIT, % | 3.07 | 2.56 | 2.75 | 2.77 | 5.27 | 3.28 | 3.28 | 3.28 | 3.28 | 3.28 |
| Total Cash | 87,285.0 | 68,410.0 | 52,559.0 | 53,642.0 | 66,780.0 | 89,438.2 | 98,845.9 | 109,243.2 | 120,734.2 | 133,433.8 |
| Total Cash, percent | .0 | .0 | .0 | .0 | .0 | .0 | .0 | .0 | .0 | .0 |
| Account Receivables | 191,036.0 | 229,278.0 | 228,161.0 | 244,502.0 | 260,565.0 | 303,884.2 | 335,848.8 | 371,175.6 | 410,218.3 | 453,367.8 |
| Account Receivables, % | 23.54 | 24.64 | 21.4 | 23.14 | 21.68 | 22.88 | 22.88 | 22.88 | 22.88 | 22.88 |
| Inventories | 120,836.0 | 164,115.0 | 172,296.0 | 183,646.0 | 195,040.0 | 218,604.8 | 241,599.2 | 267,012.2 | 295,098.3 | 326,138.7 |
| Inventories, % | 14.89 | 17.64 | 16.16 | 17.38 | 16.23 | 16.46 | 16.46 | 16.46 | 16.46 | 16.46 |
| Accounts Payable | 115,502.0 | 127,988.0 | 125,409.0 | 128,780.0 | 136,673.0 | 168,169.8 | 185,859.0 | 205,408.9 | 227,015.1 | 250,894.1 |
| Accounts Payable, % | 14.23 | 13.75 | 11.76 | 12.19 | 11.37 | 12.66 | 12.66 | 12.66 | 12.66 | 12.66 |
| Capital Expenditure | -40,711.0 | -40,014.0 | -39,256.0 | -40,263.0 | -41,527.0 | -53,828.8 | -59,490.8 | -65,748.5 | -72,664.3 | -80,307.7 |
| Capital Expenditure, % | -5.02 | -4.3 | -3.68 | -3.81 | -3.46 | -4.05 | -4.05 | -4.05 | -4.05 | -4.05 |
| Tax Rate, % | 38.31 | 38.31 | 38.31 | 38.31 | 38.31 | 38.31 | 38.31 | 38.31 | 38.31 | 38.31 |
| EBITAT | 11,683.5 | 11,760.3 | 16,680.1 | 9,504.5 | 39,054.8 | 21,574.0 | 23,843.2 | 26,351.2 | 29,123.0 | 32,186.4 |
| Depreciation | ||||||||||
| Changes in Account Receivables | ||||||||||
| Changes in Inventories | ||||||||||
| Changes in Accounts Payable | ||||||||||
| Capital Expenditure | ||||||||||
| UFCF | -193,234.5 | -63,567.7 | 6,732.1 | -16,127.5 | 19,214.8 | -18,874.4 | -19,019.9 | -21,020.5 | -23,231.6 | -25,675.2 |
| WACC, % | 4.15 | 4.18 | 4.27 | 3.98 | 4.33 | 4.19 | 4.19 | 4.19 | 4.19 | 4.19 |
| PV UFCF | ||||||||||
| SUM PV UFCF | -94,859.6 | |||||||||
| Long Term Growth Rate, % | 3.00 | |||||||||
| Free cash flow (T + 1) | -26,445 | |||||||||
| Terminal Value | -2,230,885 | |||||||||
| Present Terminal Value | -1,817,366 | |||||||||
| Enterprise Value | -1,912,226 | |||||||||
| Net Debt | 258,661 | |||||||||
| Equity Value | -2,170,887 | |||||||||
| Diluted Shares Outstanding, MM | 70 | |||||||||
| Equity Value Per Share | -30,806.26 |
What You Will Receive
- Genuine Furukawa Data: Preloaded financials – including revenue and EBIT – derived from actual and projected figures.
- Comprehensive Customization: Modify all essential parameters (yellow cells) such as WACC, growth %, and tax rates.
- Immediate Valuation Updates: Automatic recalibrations to assess the effects of changes on Furukawa Electric's fair value.
- Dynamic Excel Template: Designed for quick modifications, scenario analysis, and in-depth projections.
- Efficient and Precise: Eliminate the need to build models from the ground up while ensuring accuracy and flexibility.
Key Features
- Comprehensive Historical Data: Pre-loaded with Furukawa Electric's past financial performance and future projections.
- Customizable Assumptions: Tailor revenue growth rates, profit margins, WACC, tax rates, and capital expenditures to suit your analysis.
- Adaptive Valuation Framework: Real-time adjustments to Net Present Value (NPV) and intrinsic value based on user-defined parameters.
- Multiple Scenario Analysis: Develop various forecasting scenarios to explore different valuation possibilities.
- Intuitive User Interface: Designed to be accessible for both industry professionals and newcomers, featuring a clean and organized layout.
How It Operates
- Step 1: Download the Excel file.
- Step 2: Examine the pre-filled Furukawa Electric data (historical and projected).
- Step 3: Modify key assumptions (highlighted in yellow) according to your analysis.
- Step 4: Check the automatic recalculations for Furukawa Electric’s intrinsic value.
- Step 5: Utilize the results for investment strategies or reporting purposes.
Why Opt for This Calculator?
- Designed for Experts: A sophisticated tool utilized by analysts, CFOs, and consultants.
- Accurate Data: Furukawa Electric's historical and projected financials pre-loaded for precision.
- Flexible Scenario Analysis: Effortlessly simulate various forecasts and assumptions.
- Comprehensive Outputs: Automatically computes intrinsic value, NPV, and key performance indicators.
- User-Friendly: Clear, step-by-step instructions lead you through each stage of the process.
Who Can Benefit from This Product?
- Investors: Evaluate Furukawa Electric Co., Ltd.'s valuation before making stock trades.
- CFOs and Financial Analysts: Optimize valuation methodologies and assess financial forecasts.
- Startup Founders: Discover valuation strategies from established companies like Furukawa Electric (5801T).
- Consultants: Create detailed valuation reports for your clientele.
- Students and Educators: Leverage real market data to learn and teach valuation practices.
Contents of the Template
- Pre-Populated Data: Features Furukawa Electric’s historical financial figures and projections.
- Discounted Cash Flow Model: An editable DCF valuation model with automated calculations.
- Weighted Average Cost of Capital (WACC): A dedicated worksheet for calculating WACC based on user-defined inputs.
- Essential Financial Ratios: Evaluate Furukawa Electric’s profitability, efficiency, and financial leverage.
- Customizable Parameters: Easily modify revenue growth, profit margins, and tax rates.
- User-Friendly Dashboard: Visualizations and tables that summarize key valuation outcomes.
Disclaimer
All information, articles, and product details provided on this website are for general informational and educational purposes only. We do not claim any ownership over, nor do we intend to infringe upon, any trademarks, copyrights, logos, brand names, or other intellectual property mentioned or depicted on this site. Such intellectual property remains the property of its respective owners, and any references here are made solely for identification or informational purposes, without implying any affiliation, endorsement, or partnership.
We make no representations or warranties, express or implied, regarding the accuracy, completeness, or suitability of any content or products presented. Nothing on this website should be construed as legal, tax, investment, financial, medical, or other professional advice. In addition, no part of this site—including articles or product references—constitutes a solicitation, recommendation, endorsement, advertisement, or offer to buy or sell any securities, franchises, or other financial instruments, particularly in jurisdictions where such activity would be unlawful.
All content is of a general nature and may not address the specific circumstances of any individual or entity. It is not a substitute for professional advice or services. Any actions you take based on the information provided here are strictly at your own risk. You accept full responsibility for any decisions or outcomes arising from your use of this website and agree to release us from any liability in connection with your use of, or reliance upon, the content or products found herein.