
|
Inter Mongolia Baotou Steel Union Co., Ltd. (600010.SS) Valoración de DCF |
Completamente Editable: Adáptelo A Sus Necesidades En Excel O Sheets
Diseño Profesional: Plantillas Confiables Y Estándares De La Industria
Predeterminadas Para Un Uso Rápido Y Eficiente
Compatible con MAC / PC, completamente desbloqueado
No Se Necesita Experiencia; Fáciles De Seguir
Inner Mongolia Baotou Steel Union Co., Ltd. (600010.SS) Bundle
¡Explore las perspectivas financieras de Mongolia Baotou Steel Union Co., Ltd. (600010SS) Interior con nuestra calculadora DCF fácil de usar! Simplemente ingrese sus suposiciones con respecto al crecimiento, los márgenes y los costos para calcular el valor intrínseco de Mongolia Baotou Steel Union Co., Ltd. (600010SS) interno y mejorar su estrategia de inversión.
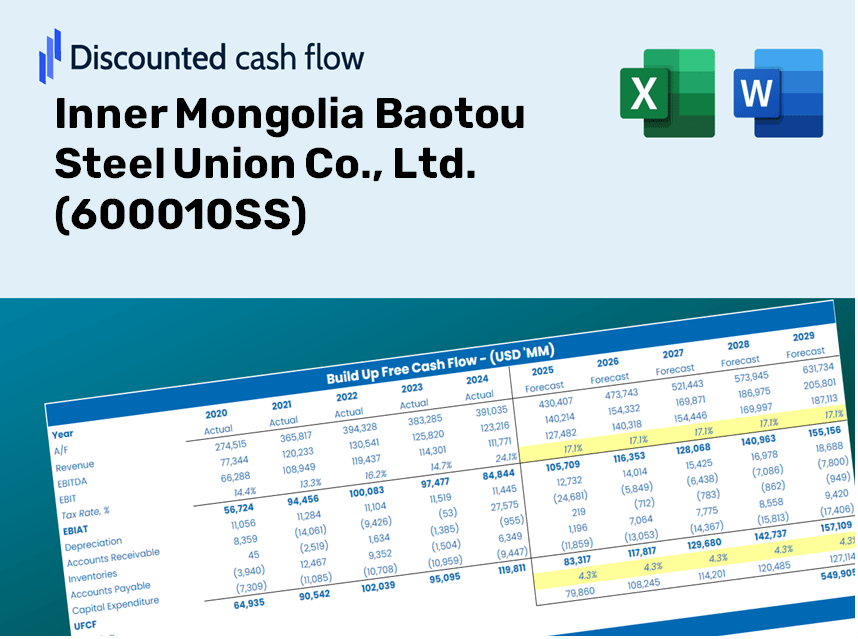
Discounted Cash Flow (DCF) - (USD MM)
| Year | AY1 2020 |
AY2 2021 |
AY3 2022 |
AY4 2023 |
AY5 2024 |
FY1 2025 |
FY2 2026 |
FY3 2027 |
FY4 2028 |
FY5 2029 |
|---|---|---|---|---|---|---|---|---|---|---|
| Revenue | 59,266.1 | 86,183.1 | 72,171.8 | 70,565.4 | 68,089.4 | 72,076.9 | 76,297.9 | 80,766.1 | 85,496.0 | 90,502.9 |
| Revenue Growth, % | 0 | 45.42 | -16.26 | -2.23 | -3.51 | 5.86 | 5.86 | 5.86 | 5.86 | 5.86 |
| EBITDA | 6,944.3 | 9,228.8 | 4,346.3 | 6,307.5 | 6,074.8 | 6,675.5 | 7,066.4 | 7,480.2 | 7,918.3 | 8,382.0 |
| EBITDA, % | 11.72 | 10.71 | 6.02 | 8.94 | 8.92 | 9.26 | 9.26 | 9.26 | 9.26 | 9.26 |
| Depreciation | 3,786.8 | 3,415.1 | 3,450.8 | 3,960.7 | 4,258.5 | 3,892.2 | 4,120.2 | 4,361.5 | 4,616.9 | 4,887.3 |
| Depreciation, % | 6.39 | 3.96 | 4.78 | 5.61 | 6.25 | 5.4 | 5.4 | 5.4 | 5.4 | 5.4 |
| EBIT | 3,157.5 | 5,813.8 | 895.6 | 2,346.8 | 1,816.2 | 2,783.2 | 2,946.2 | 3,118.8 | 3,301.4 | 3,494.8 |
| EBIT, % | 5.33 | 6.75 | 1.24 | 3.33 | 2.67 | 3.86 | 3.86 | 3.86 | 3.86 | 3.86 |
| Total Cash | 8,729.3 | 11,160.7 | 11,157.0 | 9,287.0 | 14,111.5 | 11,103.3 | 11,753.5 | 12,441.8 | 13,170.4 | 13,941.7 |
| Total Cash, percent | .0 | .0 | .0 | .0 | .0 | .0 | .0 | .0 | .0 | .0 |
| Account Receivables | 10,217.6 | 9,426.4 | 8,075.5 | 12,466.7 | 9,952.3 | 10,328.7 | 10,933.6 | 11,573.9 | 12,251.7 | 12,969.1 |
| Account Receivables, % | 17.24 | 10.94 | 11.19 | 17.67 | 14.62 | 14.33 | 14.33 | 14.33 | 14.33 | 14.33 |
| Inventories | 18,506.3 | 19,452.4 | 17,418.1 | 16,506.9 | 14,780.3 | 17,735.3 | 18,773.9 | 19,873.4 | 21,037.2 | 22,269.2 |
| Inventories, % | 31.23 | 22.57 | 24.13 | 23.39 | 21.71 | 24.61 | 24.61 | 24.61 | 24.61 | 24.61 |
| Accounts Payable | 30,887.1 | 30,551.1 | 30,576.2 | 16,735.1 | 25,922.3 | 27,636.8 | 29,255.3 | 30,968.6 | 32,782.2 | 34,702.0 |
| Accounts Payable, % | 52.12 | 35.45 | 42.37 | 23.72 | 38.07 | 38.34 | 38.34 | 38.34 | 38.34 | 38.34 |
| Capital Expenditure | -1,096.0 | -949.9 | -977.2 | -1,756.2 | -1,839.0 | -1,368.8 | -1,448.9 | -1,533.8 | -1,623.6 | -1,718.7 |
| Capital Expenditure, % | -1.85 | -1.1 | -1.35 | -2.49 | -2.7 | -1.9 | -1.9 | -1.9 | -1.9 | -1.9 |
| Tax Rate, % | -208.3 | -208.3 | -208.3 | -208.3 | -208.3 | -208.3 | -208.3 | -208.3 | -208.3 | -208.3 |
| EBITAT | 1,882.8 | 4,516.6 | 532.0 | 2,877.3 | 5,599.4 | 2,208.3 | 2,337.7 | 2,474.5 | 2,619.5 | 2,772.9 |
| Depreciation | ||||||||||
| Changes in Account Receivables | ||||||||||
| Changes in Inventories | ||||||||||
| Changes in Accounts Payable | ||||||||||
| Capital Expenditure | ||||||||||
| UFCF | 6,736.9 | 6,490.9 | 6,415.9 | -12,239.3 | 21,447.2 | 3,114.8 | 4,983.9 | 5,275.8 | 5,584.7 | 5,911.8 |
| WACC, % | 4.75 | 5.05 | 4.75 | 5.42 | 5.42 | 5.08 | 5.08 | 5.08 | 5.08 | 5.08 |
| PV UFCF | ||||||||||
| SUM PV UFCF | 21,221.3 | |||||||||
| Long Term Growth Rate, % | 2.00 | |||||||||
| Free cash flow (T + 1) | 6,030 | |||||||||
| Terminal Value | 195,920 | |||||||||
| Present Terminal Value | 152,941 | |||||||||
| Enterprise Value | 174,162 | |||||||||
| Net Debt | 11,899 | |||||||||
| Equity Value | 162,264 | |||||||||
| Diluted Shares Outstanding, MM | 45,626 | |||||||||
| Equity Value Per Share | 3.56 |
What You Will Receive
- Authentic Baotou Steel Data: Preloaded financial metrics – encompassing revenue to EBIT – derived from actual and forecasted data.
- Comprehensive Customization: Modify all essential parameters (yellow cells) such as WACC, growth %, and tax rates.
- Immediate Valuation Adjustments: Automatic recalculations to evaluate the effects of changes on Baotou Steel's fair value.
- Flexible Excel Template: Designed for rapid modifications, scenario analyses, and in-depth projections.
- Efficient and Precise: Eliminate the need to build models from the ground up while upholding accuracy and adaptability.
Key Features
- Pre-Loaded Data: Inner Mongolia Baotou Steel Union Co., Ltd.’s historical financial statements and pre-filled forecasts.
- Fully Adjustable Inputs: Modify WACC, tax rates, revenue growth, and EBITDA margins as needed.
- Instant Results: Observe the recalculation of Inner Mongolia Baotou Steel Union Co., Ltd.’s intrinsic value in real time.
- Clear Visual Outputs: Dashboard charts provide a visual representation of valuation results and key metrics.
- Built for Accuracy: A reliable tool designed for analysts, investors, and finance professionals.
How It Operates
- 1. Access the Template: Download and open the Excel file featuring Inner Mongolia Baotou Steel Union Co., Ltd.’s (600010SS) preloaded data.
- 2. Modify Assumptions: Adjust essential inputs such as growth projections, WACC, and capital expenditures.
- 3. View Results in Real-Time: The DCF model automatically computes the intrinsic value and NPV based on your inputs.
- 4. Analyze Scenarios: Explore various forecasts to evaluate different valuation results.
- 5. Present with Assurance: Share professional valuation analyses to back your strategic decisions.
Why Choose Our Services?
- Reliability: Our data utilizes verified financials specific to Inner Mongolia Baotou Steel Union Co., Ltd. (600010SS).
- Versatility: Built to allow users to experiment and adjust parameters as needed.
- Efficiency: Eliminate the lengthy process of constructing a financial model from the ground up.
- Expert-Quality: Crafted with the standards and accuracy expected by top-tier financial professionals.
- Intuitive Interface: Designed for ease of use, catering to individuals with varying levels of financial expertise.
Who Should Utilize This Product?
- Investors: Gain precise insights into the fair value of Inner Mongolia Baotou Steel Union Co., Ltd. (600010SS) before making investment choices.
- CFOs: Utilize a high-quality DCF model for accurate financial reporting and analysis.
- Consultants: Easily modify the template to create valuation reports tailored for clients.
- Entrepreneurs: Discover financial modeling techniques employed by leading companies in the steel industry.
- Educators: Implement this as an educational resource to illustrate various valuation methodologies.
Contents of the Template
- Preloaded 600010SS Data: Historical and projected financial information, encompassing revenue, EBIT, and capital expenditures.
- DCF and WACC Models: Advanced spreadsheets designed for calculating intrinsic value and Weighted Average Cost of Capital.
- Editable Inputs: Yellow-highlighted cells for customizing revenue growth, tax rates, and discount rates.
- Financial Statements: Detailed annual and quarterly financial reports for in-depth analysis.
- Key Ratios: Metrics for profitability, leverage, and efficiency to assess performance.
- Dashboard and Charts: Visual representations of valuation results and underlying assumptions.
Disclaimer
All information, articles, and product details provided on this website are for general informational and educational purposes only. We do not claim any ownership over, nor do we intend to infringe upon, any trademarks, copyrights, logos, brand names, or other intellectual property mentioned or depicted on this site. Such intellectual property remains the property of its respective owners, and any references here are made solely for identification or informational purposes, without implying any affiliation, endorsement, or partnership.
We make no representations or warranties, express or implied, regarding the accuracy, completeness, or suitability of any content or products presented. Nothing on this website should be construed as legal, tax, investment, financial, medical, or other professional advice. In addition, no part of this site—including articles or product references—constitutes a solicitation, recommendation, endorsement, advertisement, or offer to buy or sell any securities, franchises, or other financial instruments, particularly in jurisdictions where such activity would be unlawful.
All content is of a general nature and may not address the specific circumstances of any individual or entity. It is not a substitute for professional advice or services. Any actions you take based on the information provided here are strictly at your own risk. You accept full responsibility for any decisions or outcomes arising from your use of this website and agree to release us from any liability in connection with your use of, or reliance upon, the content or products found herein.