
|
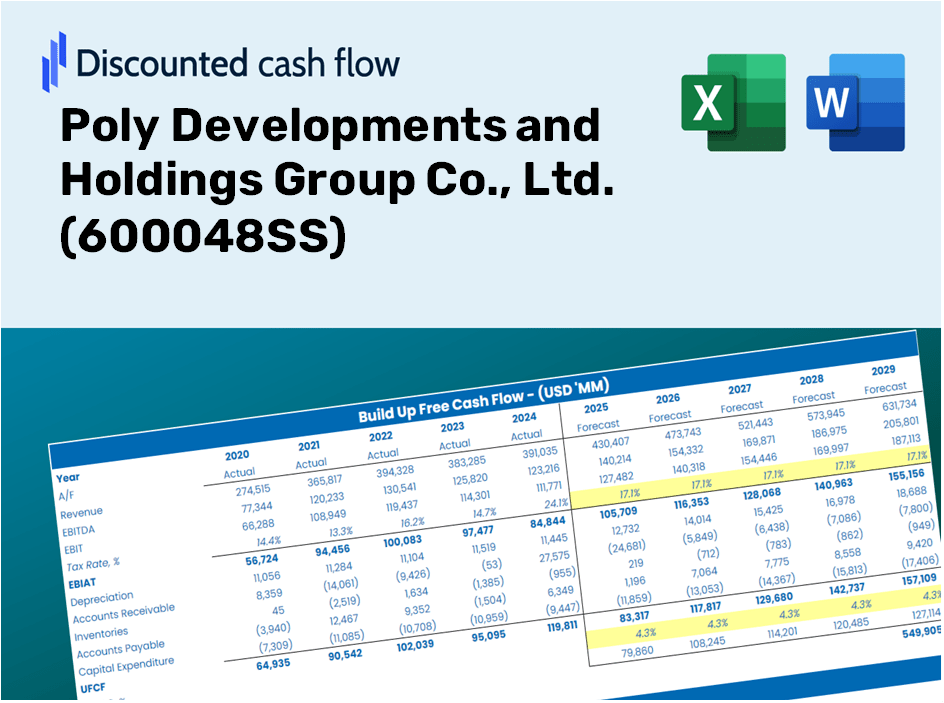
Poly Developments and Holdings Group Co., Ltd. (600048.SS) Valoración de DCF |
Completamente Editable: Adáptelo A Sus Necesidades En Excel O Sheets
Diseño Profesional: Plantillas Confiables Y Estándares De La Industria
Predeterminadas Para Un Uso Rápido Y Eficiente
Compatible con MAC / PC, completamente desbloqueado
No Se Necesita Experiencia; Fáciles De Seguir
Poly Developments and Holdings Group Co., Ltd. (600048.SS) Bundle
¿Busca determinar el valor intrínseco de Poly Developments and Holdings Group Co., Ltd.? Nuestra calculadora DCF (600048SS) integra datos del mundo real con extensas funciones de personalización, lo que le permite ajustar los pronósticos y mejorar su toma de decisiones de inversión.
Benefits You Will Receive
- Flexible Forecast Inputs: Modify key assumptions (growth %, margins, WACC) effortlessly to create various scenarios.
- Real-World Data: Poly Developments and Holdings Group Co., Ltd.'s financial information pre-filled to expedite your analysis.
- Automated DCF Outputs: The template computes Net Present Value (NPV) and intrinsic value automatically.
- Customizable and Professional: A sleek Excel model tailored to meet your valuation requirements.
- Designed for Analysts and Investors: Perfect for evaluating projections, confirming strategies, and saving valuable time.
Key Features
- Comprehensive DCF Calculator: Offers a thorough set of unlevered and levered DCF valuation models.
- WACC Calculator: Features a pre-designed Weighted Average Cost of Capital sheet with adjustable parameters.
- Customizable Forecast Assumptions: Adjust growth projections, capital expenditures, and discount rates as needed.
- Integrated Financial Ratios: Evaluate profitability, leverage, and efficiency ratios specific to Poly Developments and Holdings Group Co., Ltd. (600048SS).
- Interactive Dashboard and Charts: Visual representations convey essential valuation metrics for straightforward analysis.
How It Works
- Step 1: Download the Excel file.
- Step 2: Review the pre-filled data for Poly Developments and Holdings Group Co., Ltd. (600048SS) including historical and projected figures.
- Step 3: Modify the key assumptions (highlighted in yellow) according to your analysis.
- Step 4: Observe the automatic recalculations reflecting the intrinsic value of Poly Developments and Holdings Group Co., Ltd. (600048SS).
- Step 5: Utilize the results for your investment strategies or reporting needs.
Why Choose This Calculator for Poly Developments and Holdings Group Co., Ltd. (600048SS)?
- Accurate Data: Utilize real Poly Developments financial information for dependable valuation outcomes.
- Customizable: Modify essential factors such as growth rates, WACC, and tax rates to align with your forecasts.
- Time-Saving: Built-in calculations save you the hassle of starting from scratch.
- Professional-Grade Tool: Tailored for investors, analysts, and consultants in the industry.
- User-Friendly: Features an intuitive design and step-by-step guidance for all users.
Who Can Benefit from This Product?
- Real Estate Students: Master valuation techniques and apply them using actual market data.
- Researchers: Utilize industry-standard models in your studies or projects focused on real estate.
- Investors: Validate your investment hypotheses and evaluate valuation metrics for Poly Developments and Holdings Group Co., Ltd. (600048SS).
- Market Analysts: Enhance your analytical process with an easy-to-use, customizable DCF model.
- Property Developers: Understand the methods used in analyzing large public real estate firms like Poly Developments and Holdings Group Co., Ltd. (600048SS).
Contents of the Template
- Pre-Filled Data: Contains Poly Developments and Holdings Group Co., Ltd.'s historical financials and projections.
- Discounted Cash Flow Model: An editable DCF valuation model with automatic computations.
- Weighted Average Cost of Capital (WACC): A separate sheet for WACC calculations based on user-defined inputs.
- Key Financial Ratios: Evaluate Poly's profitability, operational efficiency, and financial leverage.
- Customizable Inputs: Effortlessly modify revenue growth assumptions, profit margins, and tax rates.
- Clear Dashboard: Visual representations and tables that summarize essential valuation outcomes.
Disclaimer
All information, articles, and product details provided on this website are for general informational and educational purposes only. We do not claim any ownership over, nor do we intend to infringe upon, any trademarks, copyrights, logos, brand names, or other intellectual property mentioned or depicted on this site. Such intellectual property remains the property of its respective owners, and any references here are made solely for identification or informational purposes, without implying any affiliation, endorsement, or partnership.
We make no representations or warranties, express or implied, regarding the accuracy, completeness, or suitability of any content or products presented. Nothing on this website should be construed as legal, tax, investment, financial, medical, or other professional advice. In addition, no part of this site—including articles or product references—constitutes a solicitation, recommendation, endorsement, advertisement, or offer to buy or sell any securities, franchises, or other financial instruments, particularly in jurisdictions where such activity would be unlawful.
All content is of a general nature and may not address the specific circumstances of any individual or entity. It is not a substitute for professional advice or services. Any actions you take based on the information provided here are strictly at your own risk. You accept full responsibility for any decisions or outcomes arising from your use of this website and agree to release us from any liability in connection with your use of, or reliance upon, the content or products found herein.