
|
Minmetals Development Co., Ltd. (600058.ss) Valoración de DCF |
Completamente Editable: Adáptelo A Sus Necesidades En Excel O Sheets
Diseño Profesional: Plantillas Confiables Y Estándares De La Industria
Predeterminadas Para Un Uso Rápido Y Eficiente
Compatible con MAC / PC, completamente desbloqueado
No Se Necesita Experiencia; Fáciles De Seguir
Minmetals Development Co., Ltd. (600058.SS) Bundle
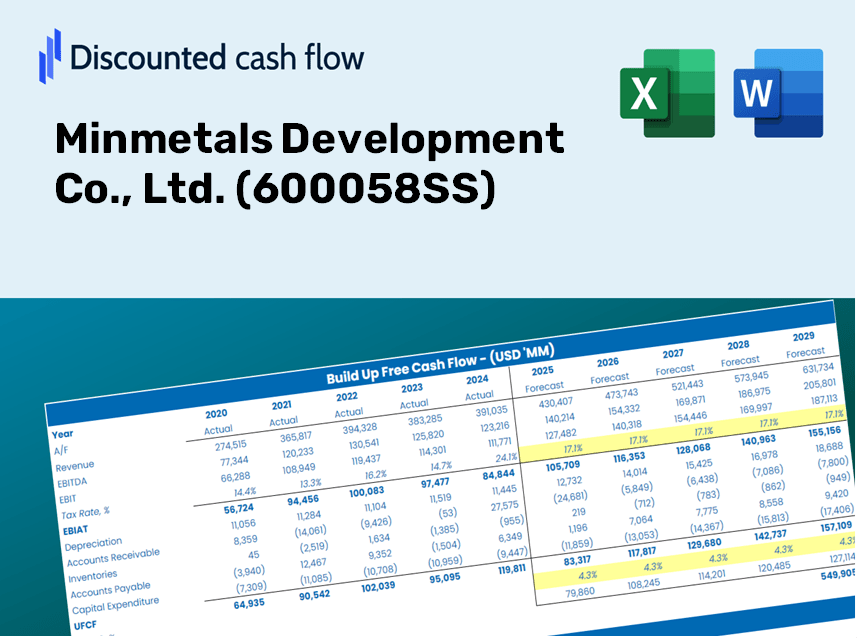
¡Evalúe Minmetals Development Co., Ltd. (600058SS) Outlook financiero como un experto! Esta calculadora DCF (600058SS) proporciona datos financieros previamente rellenos y le permite personalizar el crecimiento de los ingresos, WACC, los márgenes y otros supuestos esenciales para alinearse con sus predicciones.
Discounted Cash Flow (DCF) - (USD MM)
| Year | AY1 2020 |
AY2 2021 |
AY3 2022 |
AY4 2023 |
AY5 2024 |
FY1 2025 |
FY2 2026 |
FY3 2027 |
FY4 2028 |
FY5 2029 |
|---|---|---|---|---|---|---|---|---|---|---|
| Revenue | 67,319.4 | 87,507.7 | 81,476.9 | 78,995.7 | 67,235.8 | 68,104.0 | 68,983.4 | 69,874.2 | 70,776.5 | 71,690.4 |
| Revenue Growth, % | 0 | 29.99 | -6.89 | -3.05 | -14.89 | 1.29 | 1.29 | 1.29 | 1.29 | 1.29 |
| EBITDA | 595.0 | 1,373.0 | 1,406.0 | 1,067.6 | 709.0 | 896.8 | 908.4 | 920.2 | 932.0 | 944.1 |
| EBITDA, % | 0.88382 | 1.57 | 1.73 | 1.35 | 1.05 | 1.32 | 1.32 | 1.32 | 1.32 | 1.32 |
| Depreciation | 106.0 | 107.5 | 107.1 | 109.7 | 100.7 | 95.4 | 96.6 | 97.9 | 99.1 | 100.4 |
| Depreciation, % | 0.15749 | 0.12282 | 0.13145 | 0.13889 | 0.14971 | 0.14007 | 0.14007 | 0.14007 | 0.14007 | 0.14007 |
| EBIT | 489.0 | 1,265.5 | 1,298.9 | 957.9 | 608.3 | 801.5 | 811.8 | 822.3 | 832.9 | 843.7 |
| EBIT, % | 0.72633 | 1.45 | 1.59 | 1.21 | 0.90474 | 1.18 | 1.18 | 1.18 | 1.18 | 1.18 |
| Total Cash | 1,619.3 | 2,852.2 | 2,329.8 | 1,971.8 | 2,914.2 | 2,091.4 | 2,118.4 | 2,145.8 | 2,173.5 | 2,201.6 |
| Total Cash, percent | .0 | .0 | .0 | .0 | .0 | .0 | .0 | .0 | .0 | .0 |
| Account Receivables | 4,934.4 | 7,928.7 | 9,537.3 | 12,786.3 | 12,876.7 | 8,640.2 | 8,751.7 | 8,864.7 | 8,979.2 | 9,095.2 |
| Account Receivables, % | 7.33 | 9.06 | 11.71 | 16.19 | 19.15 | 12.69 | 12.69 | 12.69 | 12.69 | 12.69 |
| Inventories | 4,000.4 | 4,305.7 | 3,383.3 | 2,746.1 | 2,552.2 | 3,035.7 | 3,074.9 | 3,114.6 | 3,154.9 | 3,195.6 |
| Inventories, % | 5.94 | 4.92 | 4.15 | 3.48 | 3.8 | 4.46 | 4.46 | 4.46 | 4.46 | 4.46 |
| Accounts Payable | 5,947.9 | 3,270.6 | 7,508.7 | 9,133.8 | 10,548.9 | 6,679.7 | 6,765.9 | 6,853.3 | 6,941.8 | 7,031.4 |
| Accounts Payable, % | 8.84 | 3.74 | 9.22 | 11.56 | 15.69 | 9.81 | 9.81 | 9.81 | 9.81 | 9.81 |
| Capital Expenditure | -30.1 | -16.3 | -35.1 | -65.7 | -67.1 | -39.4 | -39.9 | -40.4 | -41.0 | -41.5 |
| Capital Expenditure, % | -0.04466715 | -0.01867457 | -0.04309169 | -0.08317443 | -0.09980205 | -0.05788198 | -0.05788198 | -0.05788198 | -0.05788198 | -0.05788198 |
| Tax Rate, % | 60.67 | 60.67 | 60.67 | 60.67 | 60.67 | 60.67 | 60.67 | 60.67 | 60.67 | 60.67 |
| EBITAT | 289.6 | 771.1 | 791.1 | 443.4 | 239.2 | 427.5 | 433.0 | 438.6 | 444.2 | 450.0 |
| Depreciation | ||||||||||
| Changes in Account Receivables | ||||||||||
| Changes in Inventories | ||||||||||
| Changes in Accounts Payable | ||||||||||
| Capital Expenditure | ||||||||||
| UFCF | -2,621.4 | -5,114.5 | 4,414.8 | -499.3 | 1,791.4 | 367.3 | 425.2 | 430.7 | 436.2 | 441.9 |
| WACC, % | 8.28 | 8.34 | 8.34 | 7.85 | 7.62 | 8.09 | 8.09 | 8.09 | 8.09 | 8.09 |
| PV UFCF | ||||||||||
| SUM PV UFCF | 1,663.9 | |||||||||
| Long Term Growth Rate, % | 2.00 | |||||||||
| Free cash flow (T + 1) | 451 | |||||||||
| Terminal Value | 7,404 | |||||||||
| Present Terminal Value | 5,019 | |||||||||
| Enterprise Value | 6,683 | |||||||||
| Net Debt | -2,035 | |||||||||
| Equity Value | 8,718 | |||||||||
| Diluted Shares Outstanding, MM | 1,072 | |||||||||
| Equity Value Per Share | 8.13 |
What You Will Receive
- Customizable Excel Template: A fully editable Excel-based DCF Calculator featuring pre-filled financial data for Minmetals Development Co., Ltd. (600058SS).
- Accurate Financial Data: Historical performance metrics and future projections (displayed in the highlighted cells).
- Flexible Forecasting: Adjust key assumptions such as revenue growth rates, EBITDA margins, and WACC.
- Instant Calculations: Quickly assess how changes in your inputs affect the valuation of Minmetals Development Co., Ltd. (600058SS).
- Professional-Grade Tool: Designed for investors, CFOs, consultants, and financial analysts.
- Intuitive Layout: Organized for simplicity and user-friendliness, complete with step-by-step guidance.
Key Features
- 🔍 Real-Life (600058SS) Financials: Pre-filled historical and projected data for Minmetals Development Co., Ltd.
- ✏️ Fully Customizable Inputs: Modify essential parameters (yellow cells) such as WACC, growth %, and tax rates.
- 📊 Professional DCF Valuation: Integrated formulas assess Minmetals’ intrinsic value using the Discounted Cash Flow approach.
- ⚡ Instant Results: View Minmetals’ valuation immediately after adjustments.
- Scenario Analysis: Explore and contrast various financial assumptions side-by-side.
How It Functions
- 1. Access the Template: Download and open the Excel file containing Minmetals Development Co., Ltd.'s (600058SS) preloaded data.
- 2. Modify Assumptions: Update essential inputs such as growth rates, WACC, and capital expenditures.
- 3. Analyze Results Instantly: The DCF model automatically computes intrinsic value and NPV.
- 4. Explore Scenarios: Evaluate different forecasts to assess various valuation results.
- 5. Utilize with Assurance: Present expert valuation insights to reinforce your decision-making.
Why Choose This Calculator for Minmetals Development Co., Ltd. (600058SS)?
- Designed for Industry Leaders: A sophisticated tool tailored for analysts, CFOs, and consultants in the mining sector.
- Comprehensive Data: Minmetals' historical and projected financial performance is preloaded for enhanced precision.
- Flexible Scenario Analysis: Effortlessly test various forecasts and assumptions to see their impact.
- Insightful Outputs: Automatically computes intrinsic value, NPV, and essential metrics.
- User-Friendly Interface: Step-by-step guidance to navigate you through the analysis process.
Who Can Benefit from This Product?
- Individual Investors: Make well-informed decisions regarding investments in Minmetals Development Co., Ltd. (600058SS).
- Financial Analysts: Enhance valuation methodologies with accessible financial models tailored for Minmetals Development Co., Ltd. (600058SS).
- Consultants: Provide clients with precise and timely valuation insights on Minmetals Development Co., Ltd. (600058SS).
- Business Owners: Gain insights into the valuation of major companies like Minmetals Development Co., Ltd. (600058SS) to inform your strategic direction.
- Finance Students: Acquire practical valuation skills using real data and case studies related to Minmetals Development Co., Ltd. (600058SS).
Contents of the Template
- Pre-Filled DCF Model: Minmetals Development Co., Ltd.'s (600058SS) financial data preloaded for immediate application.
- WACC Calculator: Comprehensive calculations for Weighted Average Cost of Capital specific to Minmetals Development Co., Ltd.
- Financial Ratios: Analyze Minmetals Development Co., Ltd.'s profitability, leverage, and operational efficiency.
- Editable Inputs: Adjust assumptions like growth rates, margins, and capital expenditures to match your scenarios.
- Financial Statements: Access annual and quarterly reports to facilitate in-depth analysis.
- Interactive Dashboard: Effortlessly visualize essential valuation metrics and outcomes.
Disclaimer
All information, articles, and product details provided on this website are for general informational and educational purposes only. We do not claim any ownership over, nor do we intend to infringe upon, any trademarks, copyrights, logos, brand names, or other intellectual property mentioned or depicted on this site. Such intellectual property remains the property of its respective owners, and any references here are made solely for identification or informational purposes, without implying any affiliation, endorsement, or partnership.
We make no representations or warranties, express or implied, regarding the accuracy, completeness, or suitability of any content or products presented. Nothing on this website should be construed as legal, tax, investment, financial, medical, or other professional advice. In addition, no part of this site—including articles or product references—constitutes a solicitation, recommendation, endorsement, advertisement, or offer to buy or sell any securities, franchises, or other financial instruments, particularly in jurisdictions where such activity would be unlawful.
All content is of a general nature and may not address the specific circumstances of any individual or entity. It is not a substitute for professional advice or services. Any actions you take based on the information provided here are strictly at your own risk. You accept full responsibility for any decisions or outcomes arising from your use of this website and agree to release us from any liability in connection with your use of, or reliance upon, the content or products found herein.