
|
Greattown Holdings Ltd. (600094.ss) Valoración de DCF |
Completamente Editable: Adáptelo A Sus Necesidades En Excel O Sheets
Diseño Profesional: Plantillas Confiables Y Estándares De La Industria
Predeterminadas Para Un Uso Rápido Y Eficiente
Compatible con MAC / PC, completamente desbloqueado
No Se Necesita Experiencia; Fáciles De Seguir
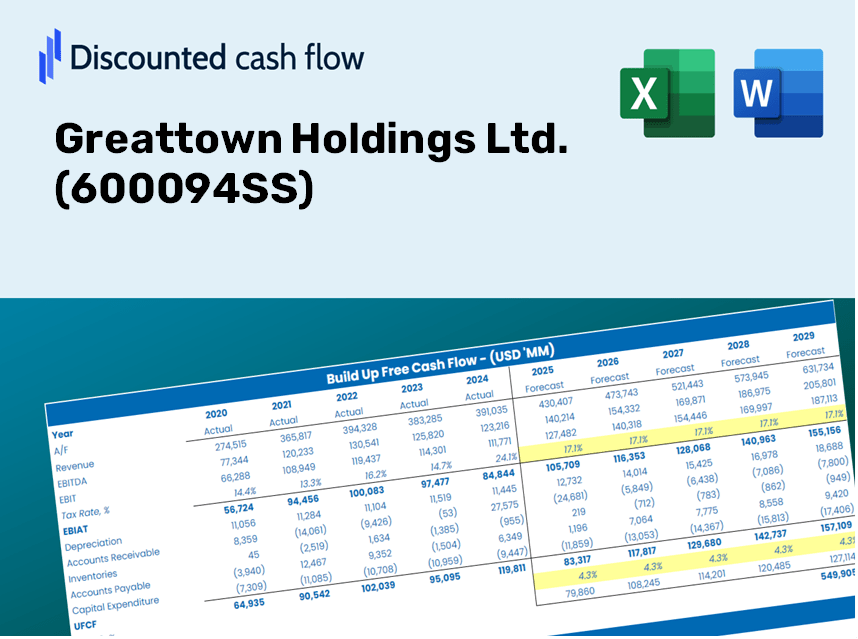
Greattown Holdings Ltd. (600094.SS) Bundle
¡Explore las perspectivas financieras de Greattown Holdings Ltd. (600094SS) con nuestra calculadora DCF fácil de usar! Ingrese sus predicciones de crecimiento, márgenes y gastos para calcular el valor intrínseco de Greattown Holdings Ltd. (600094SS) y mejorar su enfoque de inversión.
Discounted Cash Flow (DCF) - (USD MM)
| Year | AY1 2020 |
AY2 2021 |
AY3 2022 |
AY4 2023 |
AY5 2024 |
FY1 2025 |
FY2 2026 |
FY3 2027 |
FY4 2028 |
FY5 2029 |
|---|---|---|---|---|---|---|---|---|---|---|
| Revenue | 14,836.9 | 7,661.2 | 7,361.4 | 11,695.5 | 4,170.7 | 3,568.6 | 3,053.5 | 2,612.7 | 2,235.6 | 1,912.9 |
| Revenue Growth, % | 0 | -48.36 | -3.91 | 58.88 | -64.34 | -14.44 | -14.44 | -14.44 | -14.44 | -14.44 |
| EBITDA | 1,366.1 | -214.0 | 578.8 | 1,121.8 | -1,344.1 | -59.7 | -51.1 | -43.7 | -37.4 | -32.0 |
| EBITDA, % | 9.21 | -2.79 | 7.86 | 9.59 | -32.23 | -1.67 | -1.67 | -1.67 | -1.67 | -1.67 |
| Depreciation | 96.1 | 114.3 | 120.0 | 168.8 | 175.5 | 67.2 | 57.5 | 49.2 | 42.1 | 36.0 |
| Depreciation, % | 0.64761 | 1.49 | 1.63 | 1.44 | 4.21 | 1.88 | 1.88 | 1.88 | 1.88 | 1.88 |
| EBIT | 1,270.0 | -328.3 | 458.8 | 953.0 | -1,519.7 | -126.9 | -108.6 | -92.9 | -79.5 | -68.0 |
| EBIT, % | 8.56 | -4.29 | 6.23 | 8.15 | -36.44 | -3.56 | -3.56 | -3.56 | -3.56 | -3.56 |
| Total Cash | 2,386.4 | 6,306.2 | 2,496.6 | 2,309.6 | 930.8 | 1,244.6 | 1,064.9 | 911.2 | 779.7 | 667.1 |
| Total Cash, percent | .0 | .0 | .0 | .0 | .0 | .0 | .0 | .0 | .0 | .0 |
| Account Receivables | 1,062.8 | 324.3 | 243.5 | 400.7 | 424.5 | 202.0 | 172.9 | 147.9 | 126.6 | 108.3 |
| Account Receivables, % | 7.16 | 4.23 | 3.31 | 3.43 | 10.18 | 5.66 | 5.66 | 5.66 | 5.66 | 5.66 |
| Inventories | 28,599.5 | 25,678.1 | 23,414.4 | 14,956.2 | 10,274.1 | 3,568.6 | 3,053.5 | 2,612.7 | 2,235.6 | 1,912.9 |
| Inventories, % | 192.76 | 335.17 | 318.07 | 127.88 | 246.34 | 100 | 100 | 100 | 100 | 100 |
| Accounts Payable | 3,747.7 | 3,419.6 | 1,866.2 | 2,297.0 | 2,425.5 | 1,235.1 | 1,056.8 | 904.2 | 773.7 | 662.0 |
| Accounts Payable, % | 25.26 | 44.64 | 25.35 | 19.64 | 58.16 | 34.61 | 34.61 | 34.61 | 34.61 | 34.61 |
| Capital Expenditure | -42.1 | -23.4 | -7.2 | -5.0 | -6.9 | -6.4 | -5.5 | -4.7 | -4.0 | -3.4 |
| Capital Expenditure, % | -0.28378 | -0.30542 | -0.0977977 | -0.0424971 | -0.16432 | -0.17876 | -0.17876 | -0.17876 | -0.17876 | -0.17876 |
| Tax Rate, % | -30.44 | -30.44 | -30.44 | -30.44 | -30.44 | -30.44 | -30.44 | -30.44 | -30.44 | -30.44 |
| EBITAT | 756.1 | -449.0 | 235.8 | 279.8 | -1,982.3 | -86.4 | -73.9 | -63.2 | -54.1 | -46.3 |
| Depreciation | ||||||||||
| Changes in Account Receivables | ||||||||||
| Changes in Inventories | ||||||||||
| Changes in Accounts Payable | ||||||||||
| Capital Expenditure | ||||||||||
| UFCF | -25,104.6 | 2,973.6 | 1,139.8 | 9,175.4 | 2,973.3 | 5,711.9 | 344.2 | 294.5 | 252.0 | 215.6 |
| WACC, % | 6.15 | 6.53 | 6.08 | 5.87 | 6.53 | 6.23 | 6.23 | 6.23 | 6.23 | 6.23 |
| PV UFCF | ||||||||||
| SUM PV UFCF | 6,284.6 | |||||||||
| Long Term Growth Rate, % | 3.30 | |||||||||
| Free cash flow (T + 1) | 223 | |||||||||
| Terminal Value | 7,595 | |||||||||
| Present Terminal Value | 5,614 | |||||||||
| Enterprise Value | 11,898 | |||||||||
| Net Debt | 930 | |||||||||
| Equity Value | 10,969 | |||||||||
| Diluted Shares Outstanding, MM | 2,336 | |||||||||
| Equity Value Per Share | 4.70 |
What You Will Receive
- Authentic Greattown Data: Preloaded financial metrics – including revenue and EBIT – derived from actual and projected figures.
- Complete Customization: Modify all essential parameters (highlighted cells) such as WACC, growth %, and tax rates.
- Immediate Valuation Adjustments: Automatic recalculations to evaluate the effects of changes on Greattown Holdings Ltd.'s fair value.
- Flexible Excel Template: Designed for quick modifications, scenario analysis, and comprehensive forecasting.
- Efficient and Precise: Eliminate the need to build models from the ground up while ensuring accuracy and adaptability.
Key Features
- Comprehensive GTWN Data: Pre-filled with Greattown Holdings Ltd.'s historical financials and future projections.
- Fully Customizable Inputs: Modify revenue growth rates, profit margins, WACC, tax rates, and capital expenditure figures.
- Dynamic Valuation Model: Automatically updates Net Present Value (NPV) and intrinsic value based on your customized inputs.
- Scenario Testing: Develop multiple forecasting scenarios to evaluate various valuation outcomes.
- User-Friendly Design: Intuitive, well-structured, and suitable for both experienced professionals and newcomers.
How It Works
- Step 1: Download the prebuilt Excel template containing data for Greattown Holdings Ltd. (600094SS).
- Step 2: Review the pre-filled sheets to familiarize yourself with the key metrics.
- Step 3: Modify forecasts and assumptions in the editable yellow cells (WACC, growth, margins).
- Step 4: Instantly see recalculated results, including the intrinsic value of Greattown Holdings Ltd. (600094SS).
- Step 5: Use the outputs to make informed investment decisions or generate detailed reports.
Why Opt for This Calculator?
- Precise Data: Dependable Greattown Holdings Ltd. (600094SS) financial figures provide trustworthy valuation outcomes.
- Fully Customizable: Tailor essential factors such as growth rates, WACC, and tax rates to align with your forecasts.
- Efficient: Ready-made calculations save you the time of starting from the ground up.
- Professional Quality: Crafted for investors, analysts, and consultants alike.
- User-Friendly Design: Intuitive structure and detailed instructions ensure accessibility for all users.
Who Should Benefit from Greattown Holdings Ltd. (600094SS)?
- Institutional Investors: Develop comprehensive and accurate valuation models for investment portfolios.
- Corporate Finance Departments: Examine valuation scenarios to inform strategic decision-making.
- Financial Consultants and Advisors: Deliver precise valuation insights for Greattown Holdings Ltd. (600094SS) to clients.
- Academic Students and Instructors: Utilize real-world data to enhance learning and practice in financial modeling.
- Market Enthusiasts: Gain a deeper understanding of how companies like Greattown Holdings Ltd. (600094SS) are appraised in the financial market.
Contents of the Template
- Pre-Filled DCF Model: Greattown Holdings Ltd.’s financial data preloaded for immediate analysis.
- WACC Calculator: Comprehensive calculations for the Weighted Average Cost of Capital.
- Financial Ratios: Assess Greattown Holdings Ltd.’s profitability, leverage, and operational efficiency.
- Editable Inputs: Adjust assumptions like growth rates, margins, and capital expenditures to suit your scenarios.
- Financial Statements: Annual and quarterly reports available for in-depth examination.
- Interactive Dashboard: Conveniently visualize key valuation metrics and outcomes.
Disclaimer
All information, articles, and product details provided on this website are for general informational and educational purposes only. We do not claim any ownership over, nor do we intend to infringe upon, any trademarks, copyrights, logos, brand names, or other intellectual property mentioned or depicted on this site. Such intellectual property remains the property of its respective owners, and any references here are made solely for identification or informational purposes, without implying any affiliation, endorsement, or partnership.
We make no representations or warranties, express or implied, regarding the accuracy, completeness, or suitability of any content or products presented. Nothing on this website should be construed as legal, tax, investment, financial, medical, or other professional advice. In addition, no part of this site—including articles or product references—constitutes a solicitation, recommendation, endorsement, advertisement, or offer to buy or sell any securities, franchises, or other financial instruments, particularly in jurisdictions where such activity would be unlawful.
All content is of a general nature and may not address the specific circumstances of any individual or entity. It is not a substitute for professional advice or services. Any actions you take based on the information provided here are strictly at your own risk. You accept full responsibility for any decisions or outcomes arising from your use of this website and agree to release us from any liability in connection with your use of, or reliance upon, the content or products found herein.