
|
Xiangcai Co., Ltd (600095.ss) Valoración de DCF |
Completamente Editable: Adáptelo A Sus Necesidades En Excel O Sheets
Diseño Profesional: Plantillas Confiables Y Estándares De La Industria
Predeterminadas Para Un Uso Rápido Y Eficiente
Compatible con MAC / PC, completamente desbloqueado
No Se Necesita Experiencia; Fáciles De Seguir
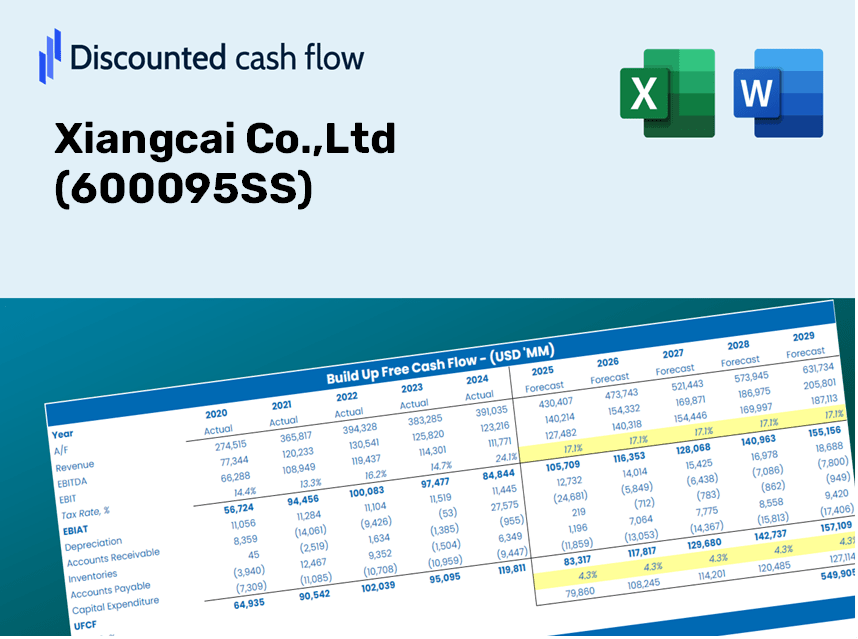
Xiangcai Co.,Ltd (600095.SS) Bundle
Ya sea que sea un inversor o analista, esta calculadora DCF (600095SS) es su recurso de referencia para una valoración precisa. Equipado con datos reales de Xiangcai Co., Ltd, puede ajustar los pronósticos y observar los efectos en tiempo real.
What You Will Receive
- Authentic XIANGCAI Financial Data: Pre-populated with Xiangcai’s historical and forecasted figures for accurate analysis.
- Completely Customizable Template: Easily adjust essential inputs such as revenue growth, WACC, and EBITDA percentage.
- Real-Time Calculations: Witness the intrinsic value of Xiangcai (600095SS) update automatically as you make changes.
- Professional Valuation Tool: Tailored for investors, analysts, and consultants aiming for precise DCF outcomes.
- User-Friendly Interface: Intuitive layout and straightforward instructions suitable for all experience levels.
Key Features
- Comprehensive DCF Calculator: Features detailed unlevered and levered DCF valuation models tailored for Xiangcai Co., Ltd (600095SS).
- WACC Calculator: Ready-to-use Weighted Average Cost of Capital sheet with adjustable inputs.
- Customizable Forecast Assumptions: Easily alter growth rates, capital expenditures, and discount rates.
- Integrated Financial Ratios: Evaluate profitability, leverage, and efficiency ratios specifically for Xiangcai Co., Ltd (600095SS).
- Visual Dashboard and Charts: Dynamic outputs that highlight key valuation metrics for straightforward analysis.
How It Operates
- Download: Obtain the pre-configured Excel file containing Xiangcai Co., Ltd's (600095SS) financial data.
- Customize: Modify your forecasts, including revenue growth, EBITDA %, and WACC to fit your analysis.
- Update in Real-Time: Watch as intrinsic value and NPV calculations refresh automatically.
- Simulate Scenarios: Generate various projections and instantly assess different outcomes.
- Drive Decisions: Leverage the valuation insights to inform your investment approach.
Why Choose the Xiangcai Co., Ltd Calculator?
- Data Integrity: Utilizes authentic Xiangcai financial data for reliable results.
- Versatility: Built to allow users to easily test and adjust variables.
- Efficiency: Eliminate the complexity of creating a DCF model from the ground up.
- Expert-Level Quality: Crafted with the precision and usability expected by financial executives.
- Accessible: Intuitive design caters to both experienced analysts and novices alike.
Who Can Benefit from This Product?
- Investors: Formulate an accurate assessment of Xiangcai Co., Ltd's (600095SS) fair value to guide investment choices.
- CFOs: Utilize a high-caliber DCF model for comprehensive financial reporting and analysis.
- Consultants: Efficiently adapt the template for client valuation reports.
- Entrepreneurs: Acquire knowledge of financial modeling practices employed by leading corporations.
- Educators: Implement it as an educational resource to illustrate valuation techniques.
Components of the Template
- Operating and Balance Sheet Data: Pre-filled historical data and forecasts for Xiangcai Co., Ltd (600095SS), including revenue, EBITDA, EBIT, and capital expenditures.
- WACC Calculation: A dedicated sheet for the Weighted Average Cost of Capital (WACC), featuring key parameters such as Beta, risk-free rate, and share price.
- DCF Valuation (Unlevered and Levered): Customizable Discounted Cash Flow models that display intrinsic value along with detailed calculations.
- Financial Statements: Pre-loaded financial statements (both annual and quarterly) to facilitate thorough analysis.
- Key Ratios: Provides profitability, leverage, and efficiency ratios specifically for Xiangcai Co., Ltd (600095SS).
- Dashboard and Charts: Visual representations of valuation outputs and assumptions to streamline result analysis.
Disclaimer
All information, articles, and product details provided on this website are for general informational and educational purposes only. We do not claim any ownership over, nor do we intend to infringe upon, any trademarks, copyrights, logos, brand names, or other intellectual property mentioned or depicted on this site. Such intellectual property remains the property of its respective owners, and any references here are made solely for identification or informational purposes, without implying any affiliation, endorsement, or partnership.
We make no representations or warranties, express or implied, regarding the accuracy, completeness, or suitability of any content or products presented. Nothing on this website should be construed as legal, tax, investment, financial, medical, or other professional advice. In addition, no part of this site—including articles or product references—constitutes a solicitation, recommendation, endorsement, advertisement, or offer to buy or sell any securities, franchises, or other financial instruments, particularly in jurisdictions where such activity would be unlawful.
All content is of a general nature and may not address the specific circumstances of any individual or entity. It is not a substitute for professional advice or services. Any actions you take based on the information provided here are strictly at your own risk. You accept full responsibility for any decisions or outcomes arising from your use of this website and agree to release us from any liability in connection with your use of, or reliance upon, the content or products found herein.