
|
Wuhan East Lake High Technology Group Co., Ltd. (600133.ss) Valoración de DCF |
Completamente Editable: Adáptelo A Sus Necesidades En Excel O Sheets
Diseño Profesional: Plantillas Confiables Y Estándares De La Industria
Predeterminadas Para Un Uso Rápido Y Eficiente
Compatible con MAC / PC, completamente desbloqueado
No Se Necesita Experiencia; Fáciles De Seguir
Wuhan East Lake High Technology Group Co., Ltd. (600133.SS) Bundle
¡Agilice su análisis y aumente la precisión con nuestra calculadora DCF (600133SS)! Utilizando datos reales de Wuhan East Lake High Technology Group Co., Ltd. y suposiciones personalizables, esta herramienta le permite pronosticar, analizar y evaluar (600133SS) al igual que un inversor experimentado.
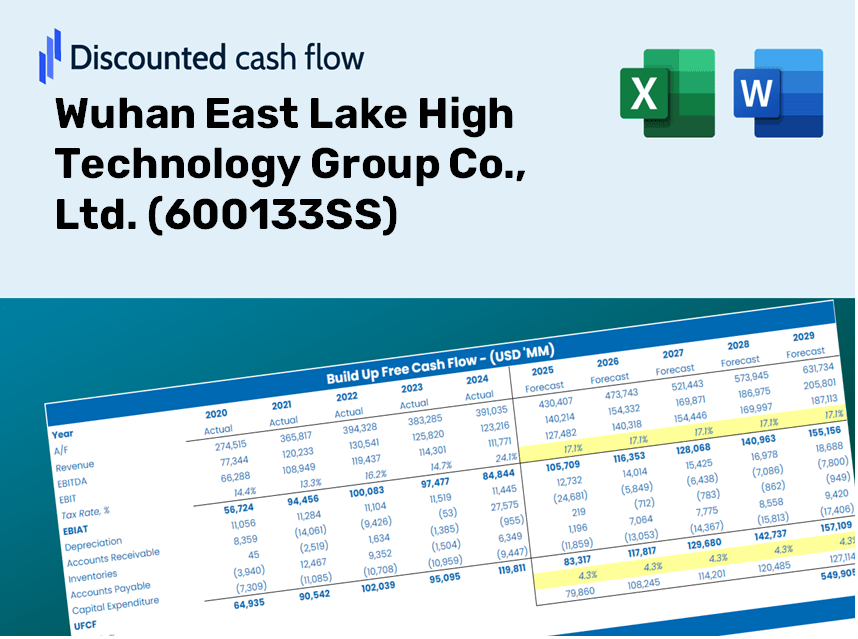
Discounted Cash Flow (DCF) - (USD MM)
| Year | AY1 2020 |
AY2 2021 |
AY3 2022 |
AY4 2023 |
AY5 2024 |
FY1 2025 |
FY2 2026 |
FY3 2027 |
FY4 2028 |
FY5 2029 |
|---|---|---|---|---|---|---|---|---|---|---|
| Revenue | 10,593.8 | 12,139.9 | 13,986.1 | 14,673.4 | 3,367.1 | 3,010.8 | 2,692.1 | 2,407.2 | 2,152.4 | 1,924.6 |
| Revenue Growth, % | 0 | 14.6 | 15.21 | 4.91 | -77.05 | -10.58 | -10.58 | -10.58 | -10.58 | -10.58 |
| EBITDA | 1,310.9 | 1,237.4 | 1,165.6 | 1,208.0 | 868.2 | 390.9 | 349.5 | 312.5 | 279.5 | 249.9 |
| EBITDA, % | 12.37 | 10.19 | 8.33 | 8.23 | 25.78 | 12.98 | 12.98 | 12.98 | 12.98 | 12.98 |
| Depreciation | 290.9 | 279.5 | 274.1 | 283.9 | 288.1 | 105.4 | 94.2 | 84.2 | 75.3 | 67.4 |
| Depreciation, % | 2.75 | 2.3 | 1.96 | 1.94 | 8.56 | 3.5 | 3.5 | 3.5 | 3.5 | 3.5 |
| EBIT | 1,020.0 | 958.0 | 891.5 | 924.0 | 580.1 | 285.5 | 255.3 | 228.3 | 204.1 | 182.5 |
| EBIT, % | 9.63 | 7.89 | 6.37 | 6.3 | 17.23 | 9.48 | 9.48 | 9.48 | 9.48 | 9.48 |
| Total Cash | 4,471.2 | 3,769.0 | 5,667.5 | 2,906.1 | 2,974.6 | 1,336.3 | 1,194.9 | 1,068.4 | 955.3 | 854.2 |
| Total Cash, percent | .0 | .0 | .0 | .0 | .0 | .0 | .0 | .0 | .0 | .0 |
| Account Receivables | 9,018.9 | 9,638.1 | 15,063.4 | 1,734.8 | 2,113.6 | 2,042.0 | 1,825.9 | 1,632.6 | 1,459.8 | 1,305.3 |
| Account Receivables, % | 85.13 | 79.39 | 107.7 | 11.82 | 62.77 | 67.82 | 67.82 | 67.82 | 67.82 | 67.82 |
| Inventories | 3,994.5 | 3,188.6 | 3,006.8 | 4,007.8 | 4,143.4 | 1,281.3 | 1,145.7 | 1,024.4 | 916.0 | 819.0 |
| Inventories, % | 37.71 | 26.27 | 21.5 | 27.31 | 123.05 | 42.56 | 42.56 | 42.56 | 42.56 | 42.56 |
| Accounts Payable | 4,660.9 | 4,989.7 | 8,883.5 | 712.8 | 2,075.8 | 1,295.4 | 1,158.3 | 1,035.7 | 926.1 | 828.0 |
| Accounts Payable, % | 44 | 41.1 | 63.52 | 4.86 | 61.65 | 43.02 | 43.02 | 43.02 | 43.02 | 43.02 |
| Capital Expenditure | -317.9 | -176.9 | -376.1 | -243.2 | -246.3 | -97.1 | -86.8 | -77.6 | -69.4 | -62.1 |
| Capital Expenditure, % | -3 | -1.46 | -2.69 | -1.66 | -7.32 | -3.22 | -3.22 | -3.22 | -3.22 | -3.22 |
| Tax Rate, % | 26.88 | 26.88 | 26.88 | 26.88 | 26.88 | 26.88 | 26.88 | 26.88 | 26.88 | 26.88 |
| EBITAT | 810.4 | 592.5 | 558.5 | 566.5 | 424.1 | 193.2 | 172.8 | 154.5 | 138.1 | 123.5 |
| Depreciation | ||||||||||
| Changes in Account Receivables | ||||||||||
| Changes in Inventories | ||||||||||
| Changes in Accounts Payable | ||||||||||
| Capital Expenditure | ||||||||||
| UFCF | -7,569.2 | 1,210.6 | -893.3 | 4,764.2 | 1,314.5 | 2,354.8 | 394.8 | 353.1 | 315.7 | 282.3 |
| WACC, % | 6.16 | 5.95 | 5.96 | 5.94 | 6.09 | 6.02 | 6.02 | 6.02 | 6.02 | 6.02 |
| PV UFCF | ||||||||||
| SUM PV UFCF | 3,329.3 | |||||||||
| Long Term Growth Rate, % | 2.00 | |||||||||
| Free cash flow (T + 1) | 288 | |||||||||
| Terminal Value | 7,163 | |||||||||
| Present Terminal Value | 5,347 | |||||||||
| Enterprise Value | 8,677 | |||||||||
| Net Debt | 554 | |||||||||
| Equity Value | 8,122 | |||||||||
| Diluted Shares Outstanding, MM | 1,093 | |||||||||
| Equity Value Per Share | 7.43 |
Benefits You Will Receive
- Accurate 600133SS Financial Data: Pre-populated with Wuhan East Lake High Technology Group’s historical and forecasted data for detailed analysis.
- Fully Customizable Template: Easily adjust essential inputs such as revenue growth, WACC, and EBITDA margins.
- Instant Calculations: Watch as the intrinsic value of 600133SS updates in real-time with your adjustments.
- Professional Valuation Tool: Created for investors, analysts, and consultants aiming for precise DCF outcomes.
- User-Friendly Interface: Straightforward layout and clear guidance suitable for users of all skill levels.
Highlighted Features
- Genuine Wuhan East Lake Financials: Gain access to precise historical data and future forecasts that are pre-loaded.
- Adjustable Forecast Parameters: Modify the yellow-highlighted cells including WACC, growth rates, and profit margins.
- Real-Time Calculations: Automatic updates for Discounted Cash Flow (DCF), Net Present Value (NPV), and cash flow evaluations.
- Interactive Dashboard: User-friendly charts and summaries to help visualize your valuation insights.
- Suitable for All Users: An intuitive and straightforward layout designed for investors, CFOs, and consultants alike.
How It Works
- Download: Obtain the pre-configured Excel file containing Wuhan East Lake High Technology Group Co., Ltd.'s (600133SS) financial data.
- Customize: Modify forecasts such as revenue growth, EBITDA %, and WACC according to your analysis.
- Update Automatically: Watch as the intrinsic value and NPV calculations refresh in real-time.
- Test Scenarios: Develop various projections and instantly compare results.
- Make Decisions: Leverage the valuation outcomes to shape your investment strategy.
Why Choose This Calculator for Wuhan East Lake High Technology Group Co., Ltd. (600133SS)?
- User-Friendly Interface: Intuitive design suitable for both novices and seasoned users.
- Customizable Inputs: Easily adjust parameters to tailor your financial analysis.
- Real-Time Updates: Witness immediate changes in Wuhan East Lake’s valuation as you modify inputs.
- Pre-Loaded Data: Access comprehensive financial data for Wuhan East Lake for quick and efficient assessments.
- Preferred by Experts: Trusted by analysts and investors for making well-informed investment choices.
Who Should Consider Using This Product?
- Institutional Investors: Develop comprehensive and dependable valuation models for investment assessments in Wuhan East Lake High Technology Group Co., Ltd. (600133SS).
- Corporate Finance Departments: Evaluate valuation scenarios to inform strategic decisions within the organization.
- Consultants and Financial Advisors: Deliver precise valuation insights for clients investing in Wuhan East Lake High Technology Group Co., Ltd. (600133SS).
- Students and Educators: Leverage real-life data to practice and instruct financial modeling techniques.
- Technology Enthusiasts: Gain insight into how technology firms like Wuhan East Lake High Technology Group Co., Ltd. (600133SS) are valued in the financial markets.
Contents of the Template
- Operating and Balance Sheet Data: Pre-filled historical data and forecasts for Wuhan East Lake High Technology Group Co., Ltd. (600133SS), including revenue, EBITDA, EBIT, and capital expenditures.
- WACC Calculation: A dedicated sheet for calculating the Weighted Average Cost of Capital (WACC), featuring parameters such as Beta, risk-free rate, and share price.
- DCF Valuation (Unlevered and Levered): Customizable Discounted Cash Flow models that illustrate intrinsic value with thorough calculations.
- Financial Statements: Pre-loaded financial statements (annual and quarterly) to facilitate in-depth analysis.
- Key Ratios: Includes key profitability, leverage, and efficiency ratios for Wuhan East Lake High Technology Group Co., Ltd. (600133SS).
- Dashboard and Charts: A visual summary of valuation results and underlying assumptions for easier analysis of outcomes.
Disclaimer
All information, articles, and product details provided on this website are for general informational and educational purposes only. We do not claim any ownership over, nor do we intend to infringe upon, any trademarks, copyrights, logos, brand names, or other intellectual property mentioned or depicted on this site. Such intellectual property remains the property of its respective owners, and any references here are made solely for identification or informational purposes, without implying any affiliation, endorsement, or partnership.
We make no representations or warranties, express or implied, regarding the accuracy, completeness, or suitability of any content or products presented. Nothing on this website should be construed as legal, tax, investment, financial, medical, or other professional advice. In addition, no part of this site—including articles or product references—constitutes a solicitation, recommendation, endorsement, advertisement, or offer to buy or sell any securities, franchises, or other financial instruments, particularly in jurisdictions where such activity would be unlawful.
All content is of a general nature and may not address the specific circumstances of any individual or entity. It is not a substitute for professional advice or services. Any actions you take based on the information provided here are strictly at your own risk. You accept full responsibility for any decisions or outcomes arising from your use of this website and agree to release us from any liability in connection with your use of, or reliance upon, the content or products found herein.