
|
Hubei Xingfa Chemicals Group Co., Ltd. (600141.SS) Valoración de DCF |
Completamente Editable: Adáptelo A Sus Necesidades En Excel O Sheets
Diseño Profesional: Plantillas Confiables Y Estándares De La Industria
Predeterminadas Para Un Uso Rápido Y Eficiente
Compatible con MAC / PC, completamente desbloqueado
No Se Necesita Experiencia; Fáciles De Seguir
Hubei Xingfa Chemicals Group Co., Ltd. (600141.SS) Bundle
¡Evalúe la perspectiva financiera de Hubei Xingfa Chemicals Group Co., Ltd. como un experto! Esta calculadora DCF (600141SS) viene con datos financieros previamente llenos y ofrece flexibilidad total para modificar el crecimiento de los ingresos, WACC, los márgenes y otros supuestos esenciales para alinearse con sus predicciones.
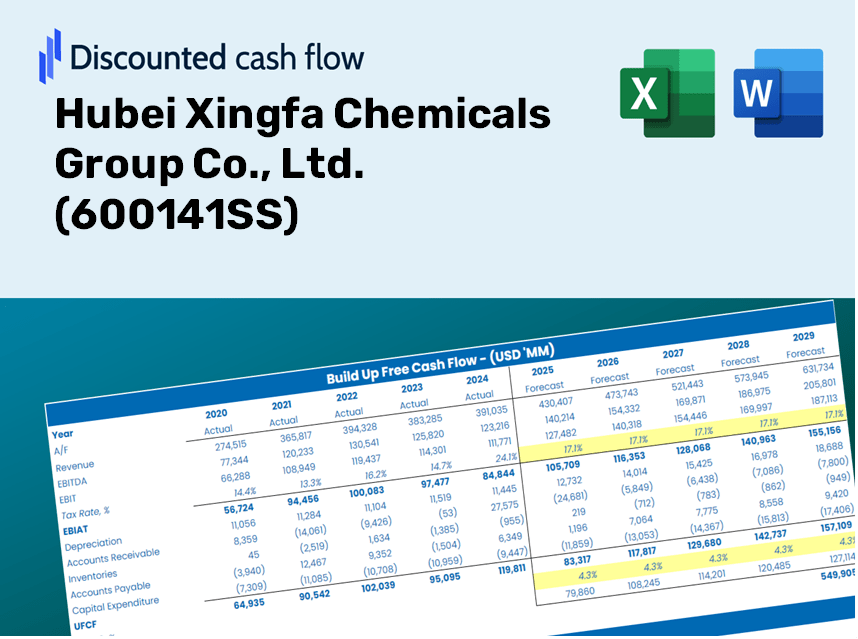
Discounted Cash Flow (DCF) - (USD MM)
| Year | AY1 2020 |
AY2 2021 |
AY3 2022 |
AY4 2023 |
AY5 2024 |
FY1 2025 |
FY2 2026 |
FY3 2027 |
FY4 2028 |
FY5 2029 |
|---|---|---|---|---|---|---|---|---|---|---|
| Revenue | 18,389.7 | 23,705.8 | 30,310.7 | 28,105.3 | 28,396.5 | 28,995.9 | 29,608.0 | 30,233.0 | 30,871.1 | 31,522.8 |
| Revenue Growth, % | 0 | 28.91 | 27.86 | -7.28 | 1.04 | 2.11 | 2.11 | 2.11 | 2.11 | 2.11 |
| EBITDA | 2,299.7 | 7,070.1 | 9,708.8 | 3,804.4 | 4,397.7 | 5,995.4 | 6,122.0 | 6,251.2 | 6,383.2 | 6,517.9 |
| EBITDA, % | 12.51 | 29.82 | 32.03 | 13.54 | 15.49 | 20.68 | 20.68 | 20.68 | 20.68 | 20.68 |
| Depreciation | 1,098.9 | 1,303.5 | 1,708.1 | 2,042.2 | 2,306.5 | 1,884.7 | 1,924.5 | 1,965.1 | 2,006.6 | 2,048.9 |
| Depreciation, % | 5.98 | 5.5 | 5.64 | 7.27 | 8.12 | 6.5 | 6.5 | 6.5 | 6.5 | 6.5 |
| EBIT | 1,200.8 | 5,766.6 | 8,000.7 | 1,762.1 | 2,091.2 | 4,110.7 | 4,197.5 | 4,286.1 | 4,376.6 | 4,469.0 |
| EBIT, % | 6.53 | 24.33 | 26.4 | 6.27 | 7.36 | 14.18 | 14.18 | 14.18 | 14.18 | 14.18 |
| Total Cash | 2,181.8 | 3,198.3 | 4,791.3 | 2,320.4 | 1,525.3 | 3,177.4 | 3,244.5 | 3,313.0 | 3,382.9 | 3,454.3 |
| Total Cash, percent | .0 | .0 | .0 | .0 | .0 | .0 | .0 | .0 | .0 | .0 |
| Account Receivables | 1,806.8 | 1,985.2 | 1,584.0 | 2,332.9 | 2,521.1 | 2,354.7 | 2,404.4 | 2,455.2 | 2,507.0 | 2,559.9 |
| Account Receivables, % | 9.82 | 8.37 | 5.23 | 8.3 | 8.88 | 8.12 | 8.12 | 8.12 | 8.12 | 8.12 |
| Inventories | 1,506.3 | 2,393.5 | 2,521.0 | 2,234.5 | 3,539.5 | 2,726.8 | 2,784.4 | 2,843.1 | 2,903.1 | 2,964.4 |
| Inventories, % | 8.19 | 10.1 | 8.32 | 7.95 | 12.46 | 9.4 | 9.4 | 9.4 | 9.4 | 9.4 |
| Accounts Payable | 3,273.8 | 4,284.8 | 4,292.6 | 5,359.7 | 6,177.7 | 5,269.4 | 5,380.6 | 5,494.2 | 5,610.2 | 5,728.6 |
| Accounts Payable, % | 17.8 | 18.08 | 14.16 | 19.07 | 21.76 | 18.17 | 18.17 | 18.17 | 18.17 | 18.17 |
| Capital Expenditure | -1,039.4 | -1,390.3 | -2,364.0 | -2,432.5 | -1,503.4 | -1,929.1 | -1,969.9 | -2,011.4 | -2,053.9 | -2,097.3 |
| Capital Expenditure, % | -5.65 | -5.86 | -7.8 | -8.65 | -5.29 | -6.65 | -6.65 | -6.65 | -6.65 | -6.65 |
| Tax Rate, % | 23.14 | 23.14 | 23.14 | 23.14 | 23.14 | 23.14 | 23.14 | 23.14 | 23.14 | 23.14 |
| EBITAT | 1,066.4 | 4,591.5 | 5,948.4 | 1,416.1 | 1,607.3 | 3,288.7 | 3,358.1 | 3,429.0 | 3,501.4 | 3,575.3 |
| Depreciation | ||||||||||
| Changes in Account Receivables | ||||||||||
| Changes in Inventories | ||||||||||
| Changes in Accounts Payable | ||||||||||
| Capital Expenditure | ||||||||||
| UFCF | 1,086.6 | 4,450.2 | 5,574.0 | 1,630.7 | 1,735.2 | 3,315.0 | 3,316.7 | 3,386.7 | 3,458.2 | 3,531.2 |
| WACC, % | 5.71 | 5.61 | 5.56 | 5.62 | 5.59 | 5.62 | 5.62 | 5.62 | 5.62 | 5.62 |
| PV UFCF | ||||||||||
| SUM PV UFCF | 14,452.1 | |||||||||
| Long Term Growth Rate, % | 0.50 | |||||||||
| Free cash flow (T + 1) | 3,549 | |||||||||
| Terminal Value | 69,340 | |||||||||
| Present Terminal Value | 52,758 | |||||||||
| Enterprise Value | 67,211 | |||||||||
| Net Debt | 9,735 | |||||||||
| Equity Value | 57,475 | |||||||||
| Diluted Shares Outstanding, MM | 1,144 | |||||||||
| Equity Value Per Share | 50.25 |
What You Will Receive
- Adjustable Forecast Inputs: Easily modify key assumptions (growth %, margins, WACC) to generate various scenarios.
- Industry-Specific Data: Hubei Xingfa Chemicals' financial information pre-loaded to accelerate your evaluation.
- Automated DCF Calculations: The model provides Net Present Value (NPV) and intrinsic value calculations automatically.
- Customizable and Professional Look: A refined Excel template that caters to your valuation requirements.
- Designed for Analysts and Investors: Perfect for assessing projections, validating strategies, and increasing efficiency.
Key Features
- Comprehensive DCF Calculator: Features detailed unlevered and levered DCF valuation models tailored for Hubei Xingfa Chemicals Group Co., Ltd. (600141SS).
- WACC Analysis Tool: A pre-built Weighted Average Cost of Capital sheet with adjustable parameters for accurate financial assessment.
- Customizable Forecast Inputs: Adjust growth rates, capital expenditures, and discount rates to fit specific scenarios.
- Integrated Financial Ratios: Evaluate profitability, leverage, and efficiency ratios specifically for Hubei Xingfa Chemicals Group Co., Ltd. (600141SS).
- User-Friendly Dashboard and Visualizations: Graphical outputs present essential valuation metrics for straightforward interpretation.
How It Functions
- Step 1: Download the Excel file.
- Step 2: Examine the pre-filled data for Hubei Xingfa Chemicals Group Co., Ltd. (600141SS) (historical and forecasted).
- Step 3: Modify key assumptions (highlighted in yellow) according to your insights.
- Step 4: Observe automatic updates on the intrinsic value of Hubei Xingfa Chemicals Group Co., Ltd. (600141SS).
- Step 5: Utilize the results for investment choices or reporting needs.
Why Opt for This Calculator?
- Designed for Professionals: A sophisticated tool utilized by analysts, CFOs, and industry consultants.
- Real-Time Data: Hubei Xingfa Chemicals Group Co., Ltd. ([600141SS])'s historical and projected financial information preloaded for precision.
- Scenario Analysis: Easily simulate various forecasts and assumptions.
- Clear Results: Automatically computes intrinsic value, NPV, and essential metrics.
- User-Friendly: Step-by-step guidance ensures a smooth experience throughout the process.
Who Should Utilize This Product?
- Individual Investors: Make informed decisions regarding the purchase or sale of Hubei Xingfa Chemicals Group Co., Ltd. (600141SS) stock.
- Financial Analysts: Enhance valuation practices with accessible financial models tailored for Hubei Xingfa Chemicals Group Co., Ltd. (600141SS).
- Consultants: Provide clients with expert valuation insights on Hubei Xingfa Chemicals Group Co., Ltd. (600141SS) efficiently and accurately.
- Business Owners: Gain insights into how large corporations like Hubei Xingfa Chemicals Group Co., Ltd. (600141SS) are valued to inform your own business strategies.
- Finance Students: Explore valuation methods using real-world data and case studies involving Hubei Xingfa Chemicals Group Co., Ltd. (600141SS).
Contents of the Template
- Operating and Balance Sheet Data: Pre-filled historical data and forecasts for Hubei Xingfa Chemicals Group Co., Ltd. (600141SS), including revenue, EBITDA, EBIT, and capital expenditures.
- WACC Calculation: A dedicated sheet for calculating the Weighted Average Cost of Capital (WACC), featuring parameters such as Beta, risk-free rate, and share price.
- DCF Valuation (Unlevered and Levered): Customizable Discounted Cash Flow models illustrating intrinsic value along with detailed calculations.
- Financial Statements: Pre-loaded financial statements (annual and quarterly) to facilitate analysis.
- Key Ratios: A summary of profitability, leverage, and efficiency ratios specifically for Hubei Xingfa Chemicals Group Co., Ltd. (600141SS).
- Dashboard and Charts: A visual overview of valuation outputs and assumptions, allowing for easy result analysis.
Disclaimer
All information, articles, and product details provided on this website are for general informational and educational purposes only. We do not claim any ownership over, nor do we intend to infringe upon, any trademarks, copyrights, logos, brand names, or other intellectual property mentioned or depicted on this site. Such intellectual property remains the property of its respective owners, and any references here are made solely for identification or informational purposes, without implying any affiliation, endorsement, or partnership.
We make no representations or warranties, express or implied, regarding the accuracy, completeness, or suitability of any content or products presented. Nothing on this website should be construed as legal, tax, investment, financial, medical, or other professional advice. In addition, no part of this site—including articles or product references—constitutes a solicitation, recommendation, endorsement, advertisement, or offer to buy or sell any securities, franchises, or other financial instruments, particularly in jurisdictions where such activity would be unlawful.
All content is of a general nature and may not address the specific circumstances of any individual or entity. It is not a substitute for professional advice or services. Any actions you take based on the information provided here are strictly at your own risk. You accept full responsibility for any decisions or outcomes arising from your use of this website and agree to release us from any liability in connection with your use of, or reliance upon, the content or products found herein.