
|
Taiyuan Heavy Industry Co., Ltd. (600169.ss) Valoración de DCF |
Completamente Editable: Adáptelo A Sus Necesidades En Excel O Sheets
Diseño Profesional: Plantillas Confiables Y Estándares De La Industria
Predeterminadas Para Un Uso Rápido Y Eficiente
Compatible con MAC / PC, completamente desbloqueado
No Se Necesita Experiencia; Fáciles De Seguir
Taiyuan Heavy Industry Co., Ltd. (600169.SS) Bundle
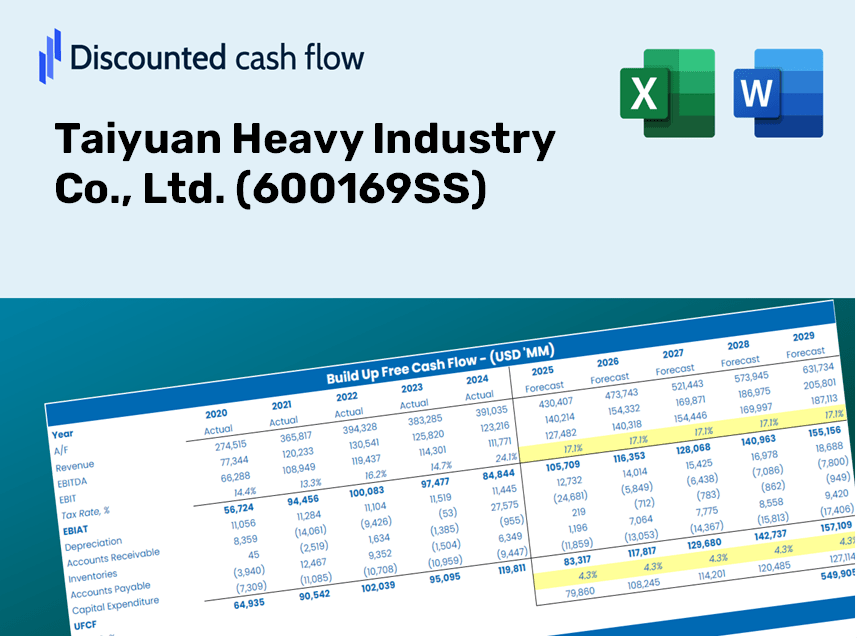
¡Obtenga información sobre su análisis de valoración de Taiyuan Heavy Industry Co., Ltd. (600169SS) utilizando nuestra sofisticada calculadora DCF! Esta plantilla de Excel viene precargada con datos reales para (600169SS), lo que le permite ajustar preventos y supuestos para calcular con precisión el valor intrínseco de Taiyuan Heavy Industry Co., Ltd.
Discounted Cash Flow (DCF) - (USD MM)
| Year | AY1 2020 |
AY2 2021 |
AY3 2022 |
AY4 2023 |
AY5 2024 |
FY1 2025 |
FY2 2026 |
FY3 2027 |
FY4 2028 |
FY5 2029 |
|---|---|---|---|---|---|---|---|---|---|---|
| Revenue | 8,610.9 | 8,320.4 | 8,039.6 | 8,354.0 | 9,248.9 | 9,431.0 | 9,616.7 | 9,806.0 | 9,999.1 | 10,195.9 |
| Revenue Growth, % | 0 | -3.37 | -3.37 | 3.91 | 10.71 | 1.97 | 1.97 | 1.97 | 1.97 | 1.97 |
| EBITDA | 708.2 | 1,052.7 | 1,043.6 | 932.9 | 1,077.2 | 1,068.9 | 1,090.0 | 1,111.4 | 1,133.3 | 1,155.6 |
| EBITDA, % | 8.22 | 12.65 | 12.98 | 11.17 | 11.65 | 11.33 | 11.33 | 11.33 | 11.33 | 11.33 |
| Depreciation | 106.3 | 377.1 | 367.8 | 317.9 | 420.2 | 352.5 | 359.5 | 366.5 | 373.8 | 381.1 |
| Depreciation, % | 1.23 | 4.53 | 4.57 | 3.81 | 4.54 | 3.74 | 3.74 | 3.74 | 3.74 | 3.74 |
| EBIT | 601.9 | 675.6 | 675.8 | 615.0 | 657.0 | 716.4 | 730.5 | 744.9 | 759.6 | 774.5 |
| EBIT, % | 6.99 | 8.12 | 8.41 | 7.36 | 7.1 | 7.6 | 7.6 | 7.6 | 7.6 | 7.6 |
| Total Cash | 4,626.6 | 2,815.2 | 2,284.6 | 1,994.3 | 1,598.5 | 2,963.9 | 3,022.3 | 3,081.8 | 3,142.5 | 3,204.3 |
| Total Cash, percent | .0 | .0 | .0 | .0 | .0 | .0 | .0 | .0 | .0 | .0 |
| Account Receivables | 7,608.4 | 9,761.7 | 9,667.1 | 9,416.7 | 9,524.2 | 9,211.4 | 9,392.8 | 9,577.7 | 9,766.3 | 9,958.5 |
| Account Receivables, % | 88.36 | 117.32 | 120.24 | 112.72 | 102.98 | 97.67 | 97.67 | 97.67 | 97.67 | 97.67 |
| Inventories | 11,409.7 | 9,422.9 | 9,847.3 | 9,988.0 | 8,918.8 | 9,363.7 | 9,548.1 | 9,736.0 | 9,927.7 | 10,123.2 |
| Inventories, % | 132.5 | 113.25 | 122.48 | 119.56 | 96.43 | 99.29 | 99.29 | 99.29 | 99.29 | 99.29 |
| Accounts Payable | 10,061.8 | 8,582.0 | 7,557.9 | 7,904.5 | 7,609.5 | 8,882.2 | 9,057.0 | 9,235.3 | 9,417.2 | 9,602.6 |
| Accounts Payable, % | 116.85 | 103.14 | 94.01 | 94.62 | 82.27 | 94.18 | 94.18 | 94.18 | 94.18 | 94.18 |
| Capital Expenditure | -398.6 | -225.9 | -390.4 | -680.2 | -1,310.2 | -650.9 | -663.7 | -676.8 | -690.1 | -703.7 |
| Capital Expenditure, % | -4.63 | -2.72 | -4.86 | -8.14 | -14.17 | -6.9 | -6.9 | -6.9 | -6.9 | -6.9 |
| Tax Rate, % | 31.2 | 31.2 | 31.2 | 31.2 | 31.2 | 31.2 | 31.2 | 31.2 | 31.2 | 31.2 |
| EBITAT | 268.4 | 614.7 | 597.1 | 566.1 | 452.0 | 551.3 | 562.2 | 573.2 | 584.5 | 596.0 |
| Depreciation | ||||||||||
| Changes in Account Receivables | ||||||||||
| Changes in Inventories | ||||||||||
| Changes in Accounts Payable | ||||||||||
| Capital Expenditure | ||||||||||
| UFCF | -8,980.2 | -880.4 | -779.5 | 660.1 | 228.7 | 1,393.5 | 67.1 | 68.4 | 69.7 | 71.1 |
| WACC, % | 3.68 | 4.93 | 4.86 | 4.96 | 4.34 | 4.56 | 4.56 | 4.56 | 4.56 | 4.56 |
| PV UFCF | ||||||||||
| SUM PV UFCF | 1,569.2 | |||||||||
| Long Term Growth Rate, % | 2.00 | |||||||||
| Free cash flow (T + 1) | 73 | |||||||||
| Terminal Value | 2,838 | |||||||||
| Present Terminal Value | 2,271 | |||||||||
| Enterprise Value | 3,840 | |||||||||
| Net Debt | 9,716 | |||||||||
| Equity Value | -5,875 | |||||||||
| Diluted Shares Outstanding, MM | 3,345 | |||||||||
| Equity Value Per Share | -1.76 |
What You Will Receive
- Authentic TAIYUAN Financial Data: Comes pre-loaded with historical and projected figures for accurate analysis of Taiyuan Heavy Industry Co., Ltd. (600169SS).
- Completely Customizable Template: Easily adjust crucial inputs like revenue growth, WACC, and EBITDA percentage.
- Instant Calculations: Observe real-time updates of Taiyuan's intrinsic value as you make modifications.
- Expert Valuation Tool: Tailored for investors, analysts, and consultants seeking reliable DCF outcomes.
- Intuitive Design: Features a straightforward layout and clear guidance suitable for all skill levels.
Key Features
- Real-Time THI Data: Pre-loaded with Taiyuan Heavy Industry's historical financial performance and future estimates.
- Completely Customizable Parameters: Modify growth rates, profit margins, discount rates, tax rates, and capital investments to fit your analysis.
- Interactive Valuation Model: Automatic recalculations of Net Present Value (NPV) and intrinsic value based on user-defined parameters.
- Multiple Scenario Analysis: Develop various forecasting scenarios to evaluate different outcomes in valuation.
- User-Centric Interface: Designed for ease of use, catering to both experienced professionals and newcomers.
Process Overview
- Step 1: Download the Excel file.
- Step 2: Examine the pre-filled data for Taiyuan Heavy Industry Co., Ltd. (600169SS) (historical and projected).
- Step 3: Modify key assumptions (highlighted in yellow) based on your analysis.
- Step 4: Observe the automatic recalculations for the intrinsic value of Taiyuan Heavy Industry Co., Ltd. (600169SS).
- Step 5: Utilize the results for investment strategies or reports.
Why Choose This Calculator for Taiyuan Heavy Industry Co., Ltd. (600169SS)?
- User-Friendly Interface: Designed to cater to both novices and seasoned professionals.
- Customizable Inputs: Modify parameters effortlessly to tailor your analysis.
- Real-Time Insights: Observe immediate adjustments in Taiyuan's valuation as you change inputs.
- Preloaded Data: Comes equipped with Taiyuan's actual financial information for swift evaluations.
- Preferred by Experts: A go-to tool for investors and analysts seeking informed insights.
Who Can Benefit from This Product?
- Investors: Obtain precise valuations for Taiyuan Heavy Industry Co., Ltd. (600169SS) to inform your investment choices.
- CFOs: Utilize a top-tier DCF model for comprehensive financial analysis and reporting.
- Consultants: Seamlessly customize the template for client valuation reports.
- Entrepreneurs: Discover financial modeling techniques employed by major industry players.
- Educators: Employ this tool to illustrate valuation methods in the classroom.
Contents of the Template
- Preloaded THI Data: Extensive historical and projected financial information, including revenue, EBIT, and capital expenditures.
- DCF and WACC Models: Sophisticated models designed for calculating intrinsic value and Weighted Average Cost of Capital.
- Editable Inputs: Yellow-highlighted fields for customizing revenue growth, tax rates, and discount rates.
- Financial Statements: Detailed annual and quarterly financial statements for thorough analysis.
- Key Ratios: Metrics for profitability, leverage, and efficiency to assess performance.
- Dashboard and Charts: Visual representations of valuation results and underlying assumptions.
Disclaimer
All information, articles, and product details provided on this website are for general informational and educational purposes only. We do not claim any ownership over, nor do we intend to infringe upon, any trademarks, copyrights, logos, brand names, or other intellectual property mentioned or depicted on this site. Such intellectual property remains the property of its respective owners, and any references here are made solely for identification or informational purposes, without implying any affiliation, endorsement, or partnership.
We make no representations or warranties, express or implied, regarding the accuracy, completeness, or suitability of any content or products presented. Nothing on this website should be construed as legal, tax, investment, financial, medical, or other professional advice. In addition, no part of this site—including articles or product references—constitutes a solicitation, recommendation, endorsement, advertisement, or offer to buy or sell any securities, franchises, or other financial instruments, particularly in jurisdictions where such activity would be unlawful.
All content is of a general nature and may not address the specific circumstances of any individual or entity. It is not a substitute for professional advice or services. Any actions you take based on the information provided here are strictly at your own risk. You accept full responsibility for any decisions or outcomes arising from your use of this website and agree to release us from any liability in connection with your use of, or reliance upon, the content or products found herein.