
|
Shanghai Construction Group Co., Ltd. (600170.SS) Valoración de DCF |
Completamente Editable: Adáptelo A Sus Necesidades En Excel O Sheets
Diseño Profesional: Plantillas Confiables Y Estándares De La Industria
Predeterminadas Para Un Uso Rápido Y Eficiente
Compatible con MAC / PC, completamente desbloqueado
No Se Necesita Experiencia; Fáciles De Seguir
Shanghai Construction Group Co., Ltd. (600170.SS) Bundle
¡Evalúe la perspectiva financiera de Shanghai Construction Group Co., Ltd. como un experto! Esta calculadora DCF (600170SS) proporciona datos financieros preconsados junto con la flexibilidad para modificar el crecimiento de los ingresos, WACC, los márgenes y otros supuestos críticos para alinearse con sus proyecciones.
Benefits You Will Receive
- Customizable Excel Template: An adaptable Excel-based DCF Calculator featuring pre-loaded financials for Shanghai Construction Group Co., Ltd. (600170SS).
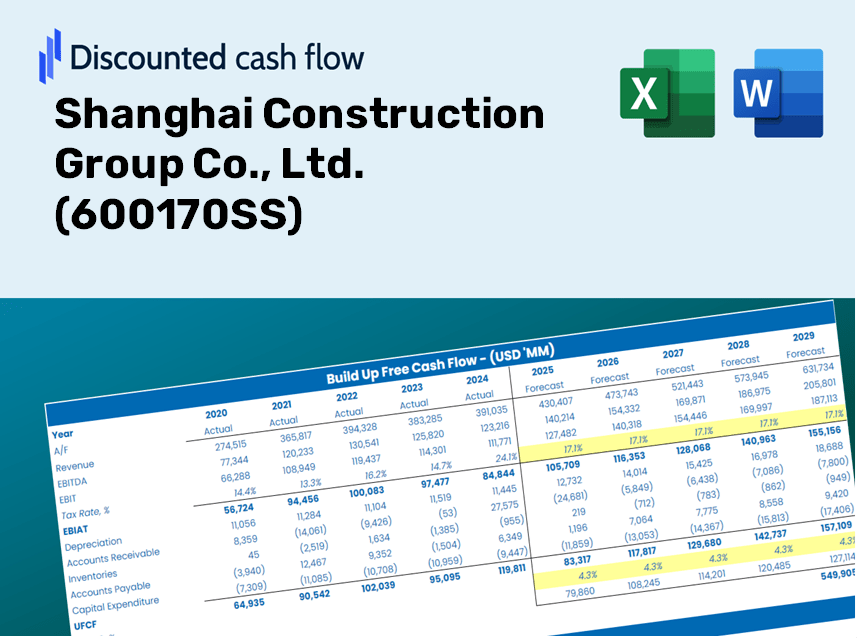
- Authentic Data: Access to historical data and forward-looking projections (highlighted in the yellow cells).
- Forecast Adaptability: Modify key assumptions such as revenue growth, EBITDA %, and WACC.
- Instant Calculations: Quickly observe how your inputs influence the valuation of Shanghai Construction Group Co., Ltd. (600170SS).
- Professional Resource: Designed for investors, CFOs, consultants, and financial analysts.
- User-Centric Layout: Organized for straightforward use, complete with step-by-step guidance.
Key Features
- Real-Life 600170SS Data: Equipped with historical financial information and future projections for Shanghai Construction Group Co., Ltd.
- Fully Customizable Inputs: Modify revenue growth, profit margins, WACC, tax rates, and capital expenditures to suit your analysis.
- Dynamic Valuation Model: Instantaneous updates to Net Present Value (NPV) and intrinsic value based on your customized inputs.
- Scenario Testing: Develop various forecasting scenarios to explore different valuation outcomes.
- User-Friendly Design: Intuitive and organized, catering to both professionals and newcomers.
How It Works
- 1. Download the Template: Obtain and open the Excel file filled with Shanghai Construction Group Co., Ltd.'s preloaded data.
- 2. Modify Assumptions: Adjust key inputs such as growth rates, WACC, and capital expenditures to fit your analysis.
- 3. Instantly View Results: The DCF model automatically computes intrinsic value and NPV based on your inputs.
- 4. Explore Scenarios: Analyze various forecasts to evaluate different valuation results.
- 5. Present with Confidence: Share professional valuation insights to bolster your decision-making for (600170SS).
Why Choose This Calculator for Shanghai Construction Group Co., Ltd. (600170SS)?
- Reliable Data: Utilize real financials from Shanghai Construction Group for precise valuation outcomes.
- Customizable Options: Tailor essential parameters such as growth rates, WACC, and tax rates to align with your forecasts.
- Efficient: Pre-configured calculations save you from building models from the ground up.
- Professional Quality: Ideal for investors, analysts, and consultants working with (600170SS).
- User-Centric Design: An intuitive interface and clear step-by-step guidance make it accessible for all users.
Who Can Benefit from This Product?
- Investors: Evaluate Shanghai Construction Group Co., Ltd.'s (600170SS) market valuation before making investment decisions.
- CFOs and Financial Analysts: Optimize valuation methods and assess financial forecasts for accuracy.
- Startup Founders: Gain insights into how established companies like Shanghai Construction Group Co., Ltd. (600170SS) are appraised.
- Consultants: Provide detailed valuation reports tailored for client needs.
- Students and Educators: Utilize real data to practice and teach valuation strategies effectively.
Overview of Template Components
- Historical Data: Features Shanghai Construction Group's past financial results and baseline forecasts.
- DCF and Levered DCF Models: Comprehensive templates to determine the intrinsic value of Shanghai Construction Group.
- WACC Sheet: Pre-calculated metrics for the Weighted Average Cost of Capital.
- Editable Inputs: Adjust key parameters such as growth rates, EBITDA %, and CAPEX estimates.
- Quarterly and Annual Statements: A thorough analysis of Shanghai Construction Group's financial statements.
- Interactive Dashboard: Dynamically visualize valuation results and forecasts.
Disclaimer
All information, articles, and product details provided on this website are for general informational and educational purposes only. We do not claim any ownership over, nor do we intend to infringe upon, any trademarks, copyrights, logos, brand names, or other intellectual property mentioned or depicted on this site. Such intellectual property remains the property of its respective owners, and any references here are made solely for identification or informational purposes, without implying any affiliation, endorsement, or partnership.
We make no representations or warranties, express or implied, regarding the accuracy, completeness, or suitability of any content or products presented. Nothing on this website should be construed as legal, tax, investment, financial, medical, or other professional advice. In addition, no part of this site—including articles or product references—constitutes a solicitation, recommendation, endorsement, advertisement, or offer to buy or sell any securities, franchises, or other financial instruments, particularly in jurisdictions where such activity would be unlawful.
All content is of a general nature and may not address the specific circumstances of any individual or entity. It is not a substitute for professional advice or services. Any actions you take based on the information provided here are strictly at your own risk. You accept full responsibility for any decisions or outcomes arising from your use of this website and agree to release us from any liability in connection with your use of, or reliance upon, the content or products found herein.