
|
Shengyi Technology Co., Ltd. (600183.ss) Valoración de DCF |
Completamente Editable: Adáptelo A Sus Necesidades En Excel O Sheets
Diseño Profesional: Plantillas Confiables Y Estándares De La Industria
Predeterminadas Para Un Uso Rápido Y Eficiente
Compatible con MAC / PC, completamente desbloqueado
No Se Necesita Experiencia; Fáciles De Seguir
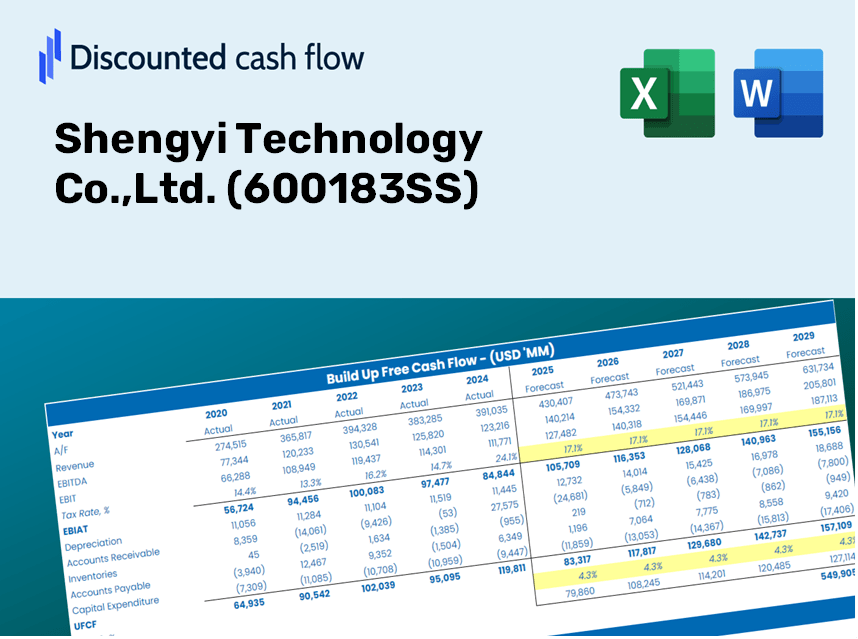
Shengyi Technology Co.,Ltd. (600183.SS) Bundle
¡Simplifique la valoración de Shengyi Technology Co., Ltd. (600183SS) con esta calculadora DCF personalizable! Con Real Shengyi Technology Co., Ltd. (600183SS) financieras y entradas de pronóstico ajustables, puede probar escenarios y descubrir Shengyi Technology Co., Ltd. (600183SS) valor razonable en minutos.
Discounted Cash Flow (DCF) - (USD MM)
| Year | AY1 2020 |
AY2 2021 |
AY3 2022 |
AY4 2023 |
AY5 2024 |
FY1 2025 |
FY2 2026 |
FY3 2027 |
FY4 2028 |
FY5 2029 |
|---|---|---|---|---|---|---|---|---|---|---|
| Revenue | 14,687.3 | 20,274.3 | 18,014.4 | 16,586.1 | 20,388.3 | 22,523.4 | 24,882.1 | 27,487.7 | 30,366.2 | 33,546.2 |
| Revenue Growth, % | 0 | 38.04 | -11.15 | -7.93 | 22.92 | 10.47 | 10.47 | 10.47 | 10.47 | 10.47 |
| EBITDA | 2,617.2 | 3,780.4 | 2,533.8 | 2,118.8 | 2,861.5 | 3,484.0 | 3,848.8 | 4,251.9 | 4,697.1 | 5,189.0 |
| EBITDA, % | 17.82 | 18.65 | 14.07 | 12.77 | 14.04 | 15.47 | 15.47 | 15.47 | 15.47 | 15.47 |
| Depreciation | 531.2 | 654.2 | 711.5 | 824.4 | 851.3 | 898.2 | 992.3 | 1,096.2 | 1,211.0 | 1,337.8 |
| Depreciation, % | 3.62 | 3.23 | 3.95 | 4.97 | 4.18 | 3.99 | 3.99 | 3.99 | 3.99 | 3.99 |
| EBIT | 2,086.0 | 3,126.1 | 1,822.3 | 1,294.4 | 2,010.2 | 2,585.8 | 2,856.5 | 3,155.7 | 3,486.1 | 3,851.2 |
| EBIT, % | 14.2 | 15.42 | 10.12 | 7.8 | 9.86 | 11.48 | 11.48 | 11.48 | 11.48 | 11.48 |
| Total Cash | 973.3 | 2,466.9 | 3,185.4 | 2,836.8 | 2,146.2 | 2,887.8 | 3,190.2 | 3,524.3 | 3,893.4 | 4,301.1 |
| Total Cash, percent | .0 | .0 | .0 | .0 | .0 | .0 | .0 | .0 | .0 | .0 |
| Account Receivables | 6,006.9 | 7,244.9 | 6,640.8 | 6,534.1 | 9,040.7 | 8,884.8 | 9,815.2 | 10,843.0 | 11,978.5 | 13,232.9 |
| Account Receivables, % | 40.9 | 35.73 | 36.86 | 39.4 | 44.34 | 39.45 | 39.45 | 39.45 | 39.45 | 39.45 |
| Inventories | 2,518.9 | 4,520.3 | 4,083.8 | 4,271.2 | 5,119.5 | 5,089.3 | 5,622.2 | 6,211.0 | 6,861.4 | 7,579.9 |
| Inventories, % | 17.15 | 22.3 | 22.67 | 25.75 | 25.11 | 22.6 | 22.6 | 22.6 | 22.6 | 22.6 |
| Accounts Payable | 3,039.6 | 4,107.0 | 2,502.3 | 2,741.3 | 5,012.5 | 4,322.5 | 4,775.2 | 5,275.2 | 5,827.6 | 6,437.9 |
| Accounts Payable, % | 20.7 | 20.26 | 13.89 | 16.53 | 24.58 | 19.19 | 19.19 | 19.19 | 19.19 | 19.19 |
| Capital Expenditure | -1,761.0 | -1,786.8 | -1,534.2 | -1,108.8 | -925.9 | -1,826.5 | -2,017.7 | -2,229.0 | -2,462.5 | -2,720.3 |
| Capital Expenditure, % | -11.99 | -8.81 | -8.52 | -6.69 | -4.54 | -8.11 | -8.11 | -8.11 | -8.11 | -8.11 |
| Tax Rate, % | 15.92 | 15.92 | 15.92 | 15.92 | 15.92 | 15.92 | 15.92 | 15.92 | 15.92 | 15.92 |
| EBITAT | 1,683.1 | 2,672.4 | 1,573.5 | 1,185.3 | 1,690.1 | 2,214.3 | 2,446.1 | 2,702.3 | 2,985.3 | 3,297.9 |
| Depreciation | ||||||||||
| Changes in Account Receivables | ||||||||||
| Changes in Inventories | ||||||||||
| Changes in Accounts Payable | ||||||||||
| Capital Expenditure | ||||||||||
| UFCF | -5,032.9 | -632.2 | 186.8 | 1,059.1 | 531.9 | 782.1 | 409.9 | 452.9 | 500.3 | 552.7 |
| WACC, % | 7.16 | 7.17 | 7.17 | 7.17 | 7.17 | 7.17 | 7.17 | 7.17 | 7.17 | 7.17 |
| PV UFCF | ||||||||||
| SUM PV UFCF | 2,225.0 | |||||||||
| Long Term Growth Rate, % | 3.00 | |||||||||
| Free cash flow (T + 1) | 569 | |||||||||
| Terminal Value | 13,659 | |||||||||
| Present Terminal Value | 9,662 | |||||||||
| Enterprise Value | 11,887 | |||||||||
| Net Debt | 411 | |||||||||
| Equity Value | 11,477 | |||||||||
| Diluted Shares Outstanding, MM | 2,382 | |||||||||
| Equity Value Per Share | 4.82 |
What You Will Receive
- Authentic 600183 Financial Data: Pre-populated with Shengyi Technology’s historic and forecasted figures for accurate analysis.
- Completely Customizable Template: Easily adjust essential inputs such as revenue growth, WACC, and EBITDA percentage.
- Instant Calculations: Observe real-time updates to Shengyi Technology’s intrinsic value as you make changes.
- Professional Valuation Resource: Tailored for investors, analysts, and consultants aiming for precise DCF outcomes.
- Intuitive User Interface: Streamlined layout and straightforward guidelines suitable for every skill level.
Key Features
- Customizable Forecast Inputs: Adjust key metrics such as revenue growth rate, EBITDA margin, and capital expenditure assumptions.
- Instant DCF Valuation: Computes intrinsic value, net present value, and other financial outputs in real-time.
- High Precision Results: Leverages Shengyi Technology's actual financial data for credible valuation assessments.
- Simplified Scenario Testing: Evaluate various assumptions and easily contrast different outcomes.
- Efficiency Booster: Avoid the hassle of creating intricate valuation models from the ground up.
How It Operates
- Download: Obtain the pre-prepared Excel file containing Shengyi Technology Co., Ltd.'s (600183SS) financial data.
- Customize: Tailor your assumptions, including revenue growth rates, EBITDA percentages, and WACC.
- Real-Time Updates: The intrinsic value and NPV calculations refresh automatically as you make changes.
- Scenario Analysis: Generate various projections and instantly evaluate their outcomes.
- Informed Decisions: Leverage the valuation findings to shape your investment approach.
Reasons to Use Shengyi Technology's Calculator
- All-in-One Solution: Features DCF, WACC, and financial ratio analyses in a single platform.
- Flexible Inputs: Modify the yellow-highlighted fields to explore different scenarios.
- In-Depth Analysis: Automatically calculates the intrinsic value and Net Present Value for Shengyi Technology Co., Ltd. (600183SS).
- Built-In Data: Comes with historical and projected data for reliable benchmarks.
- High Standards: Perfect for financial analysts, investors, and business consultants.
Who Can Benefit from Shengyi Technology Co., Ltd. (600183SS)?
- Individual Investors: Gain insights to make educated choices regarding investments in Shengyi Technology stock.
- Financial Analysts: Simplify valuation tasks with pre-built financial models tailored for Shengyi Technology.
- Consultants: Provide clients with accurate and timely valuation analyses concerning Shengyi Technology.
- Business Owners: Learn how technology firms like Shengyi Technology are valued to inform your own business strategies.
- Finance Students: Explore valuation methodologies using real-life data and case studies related to Shengyi Technology.
Contents of the Template
- Preloaded SYT Data: Historical and forecasted financial metrics, including revenue, EBIT, and capital expenditures.
- DCF and WACC Models: Advanced spreadsheets designed for calculating intrinsic value and Weighted Average Cost of Capital.
- Editable Inputs: Cells highlighted in yellow for modifying revenue growth, tax rates, and discount rates.
- Financial Statements: Detailed annual and quarterly financial reports for in-depth analysis.
- Key Ratios: Metrics for profitability, leverage, and efficiency to assess performance.
- Dashboard and Charts: Visual representations of valuation results and underlying assumptions.
Disclaimer
All information, articles, and product details provided on this website are for general informational and educational purposes only. We do not claim any ownership over, nor do we intend to infringe upon, any trademarks, copyrights, logos, brand names, or other intellectual property mentioned or depicted on this site. Such intellectual property remains the property of its respective owners, and any references here are made solely for identification or informational purposes, without implying any affiliation, endorsement, or partnership.
We make no representations or warranties, express or implied, regarding the accuracy, completeness, or suitability of any content or products presented. Nothing on this website should be construed as legal, tax, investment, financial, medical, or other professional advice. In addition, no part of this site—including articles or product references—constitutes a solicitation, recommendation, endorsement, advertisement, or offer to buy or sell any securities, franchises, or other financial instruments, particularly in jurisdictions where such activity would be unlawful.
All content is of a general nature and may not address the specific circumstances of any individual or entity. It is not a substitute for professional advice or services. Any actions you take based on the information provided here are strictly at your own risk. You accept full responsibility for any decisions or outcomes arising from your use of this website and agree to release us from any liability in connection with your use of, or reliance upon, the content or products found herein.