
|
Gree Real Estate Co., Ltd (600185.ss) Valoración de DCF |
Completamente Editable: Adáptelo A Sus Necesidades En Excel O Sheets
Diseño Profesional: Plantillas Confiables Y Estándares De La Industria
Predeterminadas Para Un Uso Rápido Y Eficiente
Compatible con MAC / PC, completamente desbloqueado
No Se Necesita Experiencia; Fáciles De Seguir
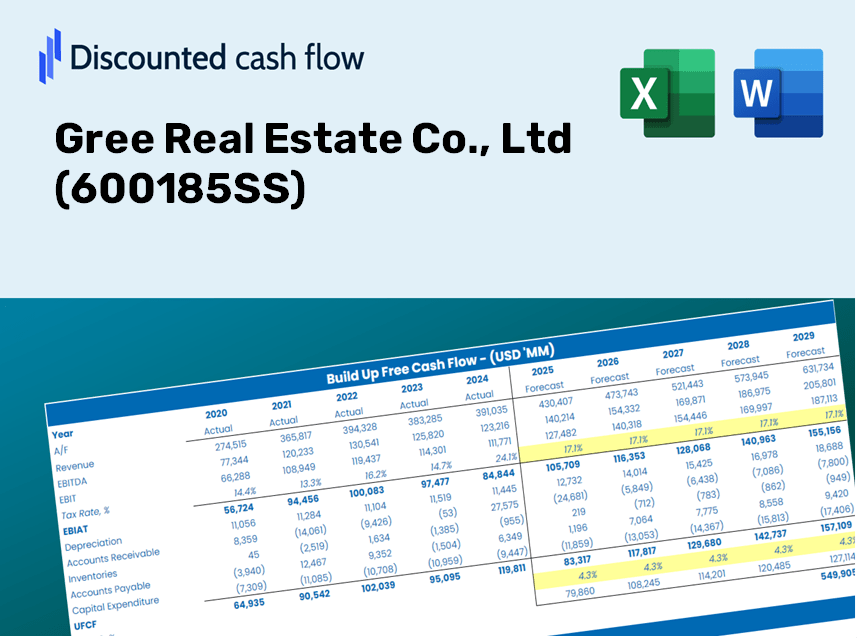
Gree Real Estate Co., Ltd (600185.SS) Bundle
¡Mejore sus opciones de inversión con la calculadora DCF (600185SS)! Ver auténticos finanzas de bienes raíces Gree, ajustar las proyecciones y gastos de crecimiento, y observar instantáneamente cómo estas alteraciones afectan el valor intrínseco de Gree Real Estate Co., Ltd.
Discounted Cash Flow (DCF) - (USD MM)
| Year | AY1 2020 |
AY2 2021 |
AY3 2022 |
AY4 2023 |
AY5 2024 |
FY1 2025 |
FY2 2026 |
FY3 2027 |
FY4 2028 |
FY5 2029 |
|---|---|---|---|---|---|---|---|---|---|---|
| Revenue | 6,389.0 | 7,133.1 | 4,046.6 | 6,997.1 | 5,276.8 | 5,497.2 | 5,726.8 | 5,965.9 | 6,215.1 | 6,474.6 |
| Revenue Growth, % | 0 | 11.65 | -43.27 | 72.91 | -24.59 | 4.18 | 4.18 | 4.18 | 4.18 | 4.18 |
| EBITDA | 1,112.6 | 949.1 | -909.0 | 984.0 | 99.6 | 266.2 | 277.3 | 288.9 | 300.9 | 313.5 |
| EBITDA, % | 17.41 | 13.31 | -22.46 | 14.06 | 1.89 | 4.84 | 4.84 | 4.84 | 4.84 | 4.84 |
| Depreciation | 18.3 | 32.8 | 41.3 | 46.2 | 42.7 | 35.6 | 37.1 | 38.6 | 40.2 | 41.9 |
| Depreciation, % | 0.28619 | 0.46027 | 1.02 | 0.66002 | 0.80961 | 0.64713 | 0.64713 | 0.64713 | 0.64713 | 0.64713 |
| EBIT | 1,094.3 | 916.3 | -950.2 | 937.8 | 56.9 | 230.6 | 240.2 | 250.2 | 260.7 | 271.6 |
| EBIT, % | 17.13 | 12.85 | -23.48 | 13.4 | 1.08 | 4.19 | 4.19 | 4.19 | 4.19 | 4.19 |
| Total Cash | 3,141.8 | 1,540.5 | 2,217.2 | 1,127.5 | 5,555.8 | 2,657.1 | 2,768.0 | 2,883.6 | 3,004.1 | 3,129.5 |
| Total Cash, percent | .0 | .0 | .0 | .0 | .0 | .0 | .0 | .0 | .0 | .0 |
| Account Receivables | 618.8 | 289.6 | 336.8 | 286.9 | 290.9 | 348.3 | 362.9 | 378.0 | 393.8 | 410.3 |
| Account Receivables, % | 9.68 | 4.06 | 8.32 | 4.1 | 5.51 | 6.34 | 6.34 | 6.34 | 6.34 | 6.34 |
| Inventories | 25,735.2 | 23,354.2 | 21,168.2 | 18,480.7 | 8,194.0 | 5,497.2 | 5,726.8 | 5,965.9 | 6,215.1 | 6,474.6 |
| Inventories, % | 402.81 | 327.41 | 523.11 | 264.12 | 155.28 | 100 | 100 | 100 | 100 | 100 |
| Accounts Payable | 2,403.7 | 1,997.4 | 2,049.7 | 1,937.3 | 1,089.7 | 1,809.8 | 1,885.4 | 1,964.1 | 2,046.2 | 2,131.6 |
| Accounts Payable, % | 37.62 | 28 | 50.65 | 27.69 | 20.65 | 32.92 | 32.92 | 32.92 | 32.92 | 32.92 |
| Capital Expenditure | -197.2 | -51.5 | -25.4 | -177.4 | -72.9 | -91.8 | -95.7 | -99.7 | -103.8 | -108.2 |
| Capital Expenditure, % | -3.09 | -0.72192 | -0.62712 | -2.54 | -1.38 | -1.67 | -1.67 | -1.67 | -1.67 | -1.67 |
| Tax Rate, % | -69.09 | -69.09 | -69.09 | -69.09 | -69.09 | -69.09 | -69.09 | -69.09 | -69.09 | -69.09 |
| EBITAT | 848.7 | 702.4 | -1,032.2 | -2,561.6 | 96.2 | 163.3 | 170.2 | 177.3 | 184.7 | 192.4 |
| Depreciation | ||||||||||
| Changes in Account Receivables | ||||||||||
| Changes in Inventories | ||||||||||
| Changes in Accounts Payable | ||||||||||
| Capital Expenditure | ||||||||||
| UFCF | -23,280.5 | 2,987.5 | 1,174.8 | -67.8 | 9,501.2 | 3,466.6 | -57.0 | -59.3 | -61.8 | -64.4 |
| WACC, % | 4.97 | 4.94 | 5.64 | 2.65 | 5.64 | 4.77 | 4.77 | 4.77 | 4.77 | 4.77 |
| PV UFCF | ||||||||||
| SUM PV UFCF | 3,103.0 | |||||||||
| Long Term Growth Rate, % | 2.00 | |||||||||
| Free cash flow (T + 1) | -66 | |||||||||
| Terminal Value | -2,374 | |||||||||
| Present Terminal Value | -1,881 | |||||||||
| Enterprise Value | 1,222 | |||||||||
| Net Debt | 4,895 | |||||||||
| Equity Value | -3,672 | |||||||||
| Diluted Shares Outstanding, MM | 1,893 | |||||||||
| Equity Value Per Share | -1.94 |
What You Will Receive
- Authentic Gree Data: Comprehensive financials – encompassing revenue and EBIT – derived from actual and forecasted figures.
- Complete Customization: Modify all key parameters (yellow cells) such as WACC, growth %, and tax rates.
- Immediate Valuation Adjustments: Automatic recalculations to assess how changes affect Gree’s fair value.
- Flexible Excel Template: Designed for quick modifications, scenario analysis, and in-depth projections.
- Efficient and Precise: Eliminate the need to build models from scratch while ensuring accuracy and adaptability.
Key Features
- Gree Real Estate Financials: Gain access to reliable pre-loaded historical data and future forecasts for Gree Real Estate Co., Ltd (600185SS).
- Customizable Projection Inputs: Modify highlighted fields such as WACC, growth rates, and profit margins to fit your analysis needs.
- Real-Time Calculations: Enjoy automatic updates for DCF, Net Present Value (NPV), and cash flow assessments.
- User-Friendly Dashboard: Effortlessly interpret your valuation results with intuitive charts and summaries.
- Designed for All Skill Levels: An accessible, easy-to-navigate format tailored for investors, CFOs, and consultants alike.
How It Operates
- Download the Template: Gain immediate access to the Excel-based Gree Real Estate DCF Calculator (600185SS).
- Input Your Assumptions: Modify the yellow-highlighted cells for growth rates, WACC, profit margins, and additional variables.
- Instant Calculations: The model automatically recalculates Gree Real Estate’s intrinsic value.
- Test Scenarios: Experiment with various assumptions to see how they impact valuation outcomes.
- Analyze and Decide: Utilize the insights to inform your investment or financial assessments.
Why Choose This Calculator for Gree Real Estate Co., Ltd (600185SS)?
- User-Friendly Interface: Tailored for both novice and seasoned users.
- Customizable Inputs: Adjust parameters easily to better suit your evaluation.
- Real-Time Adjustments: Monitor immediate changes in Gree's valuation as you update inputs.
- Pre-Configured Data: Comes ready with Gree’s latest financial metrics for swift assessments.
- Preferred by Experts: Utilized by investors and analysts for data-driven decision-making.
Who Should Utilize This Product?
- Investors: Accurately assess the fair value of Gree Real Estate Co., Ltd (600185SS) prior to making investment choices.
- CFOs: Utilize a high-quality DCF model for financial reporting and in-depth analysis.
- Consultants: Seamlessly modify the template for client valuation reports.
- Entrepreneurs: Obtain valuable insights into the financial modeling techniques applied by leading real estate firms.
- Educators: Leverage it as a teaching resource to illustrate valuation methodologies.
Contents of the Template
- Preloaded Gree Real Estate Data: Historical and forecasted financial information, including revenue, EBIT, and capital expenditures.
- DCF and WACC Models: High-quality spreadsheets for determining intrinsic value and Weighted Average Cost of Capital.
- Editable Inputs: Yellow-highlighted cells to modify revenue growth, tax rates, and discount rates.
- Financial Statements: Detailed annual and quarterly financial reports for thorough analysis.
- Key Ratios: Metrics for profitability, leverage, and efficiency to assess company performance.
- Dashboard and Charts: Visual representations of valuation results and key assumptions.
Disclaimer
All information, articles, and product details provided on this website are for general informational and educational purposes only. We do not claim any ownership over, nor do we intend to infringe upon, any trademarks, copyrights, logos, brand names, or other intellectual property mentioned or depicted on this site. Such intellectual property remains the property of its respective owners, and any references here are made solely for identification or informational purposes, without implying any affiliation, endorsement, or partnership.
We make no representations or warranties, express or implied, regarding the accuracy, completeness, or suitability of any content or products presented. Nothing on this website should be construed as legal, tax, investment, financial, medical, or other professional advice. In addition, no part of this site—including articles or product references—constitutes a solicitation, recommendation, endorsement, advertisement, or offer to buy or sell any securities, franchises, or other financial instruments, particularly in jurisdictions where such activity would be unlawful.
All content is of a general nature and may not address the specific circumstances of any individual or entity. It is not a substitute for professional advice or services. Any actions you take based on the information provided here are strictly at your own risk. You accept full responsibility for any decisions or outcomes arising from your use of this website and agree to release us from any liability in connection with your use of, or reliance upon, the content or products found herein.