
|
Jilin Forest Industry Co., Ltd. (600189.ss) Valoración de DCF |
Completamente Editable: Adáptelo A Sus Necesidades En Excel O Sheets
Diseño Profesional: Plantillas Confiables Y Estándares De La Industria
Predeterminadas Para Un Uso Rápido Y Eficiente
Compatible con MAC / PC, completamente desbloqueado
No Se Necesita Experiencia; Fáciles De Seguir
Jilin Forest Industry Co., Ltd. (600189.SS) Bundle
¡Agilice su análisis y mejore la precisión con nuestra calculadora DCF (600189SS)! Utilizando datos reales de Jilin Forest Industry Co., Ltd. y suposiciones personalizables, esta herramienta le permite pronosticar, analizar y valorar Jilin Forest como un inversor experimentado.
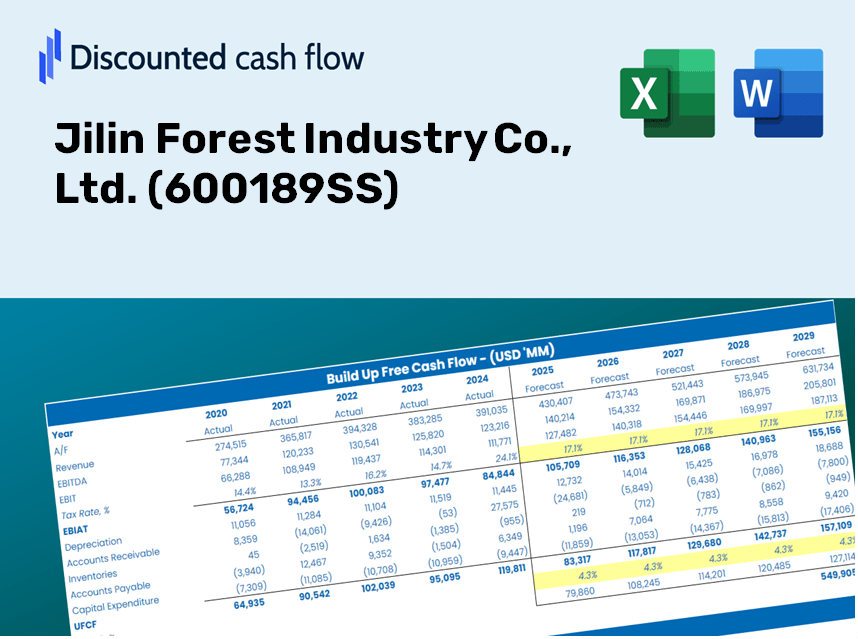
Discounted Cash Flow (DCF) - (USD MM)
| Year | AY1 2020 |
AY2 2021 |
AY3 2022 |
AY4 2023 |
AY5 2024 |
FY1 2025 |
FY2 2026 |
FY3 2027 |
FY4 2028 |
FY5 2029 |
|---|---|---|---|---|---|---|---|---|---|---|
| Revenue | 1,372.0 | 1,471.0 | 1,269.0 | 1,122.0 | 1,197.9 | 1,164.0 | 1,131.0 | 1,098.9 | 1,067.8 | 1,037.5 |
| Revenue Growth, % | 0 | 7.21 | -13.73 | -11.58 | 6.77 | -2.83 | -2.83 | -2.83 | -2.83 | -2.83 |
| EBITDA | 218.6 | 238.7 | 167.7 | -325.9 | 136.7 | 64.6 | 62.8 | 61.0 | 59.2 | 57.6 |
| EBITDA, % | 15.93 | 16.23 | 13.21 | -29.05 | 11.41 | 5.55 | 5.55 | 5.55 | 5.55 | 5.55 |
| Depreciation | 76.2 | 75.3 | 70.2 | 75.8 | 72.9 | 67.6 | 65.7 | 63.8 | 62.0 | 60.3 |
| Depreciation, % | 5.55 | 5.12 | 5.53 | 6.76 | 6.09 | 5.81 | 5.81 | 5.81 | 5.81 | 5.81 |
| EBIT | 142.4 | 163.4 | 97.5 | -401.7 | 63.8 | -3.0 | -2.9 | -2.9 | -2.8 | -2.7 |
| EBIT, % | 10.38 | 11.11 | 7.68 | -35.8 | 5.33 | -0.26077 | -0.26077 | -0.26077 | -0.26077 | -0.26077 |
| Total Cash | 599.2 | 588.3 | 626.6 | 668.5 | 862.4 | 616.0 | 598.6 | 581.6 | 565.1 | 549.1 |
| Total Cash, percent | .0 | .0 | .0 | .0 | .0 | .0 | .0 | .0 | .0 | .0 |
| Account Receivables | 1,599.8 | 1,790.6 | 1,908.3 | 1,708.0 | 1,456.6 | 1,164.0 | 1,131.0 | 1,098.9 | 1,067.8 | 1,037.5 |
| Account Receivables, % | 116.61 | 121.73 | 150.38 | 152.23 | 121.6 | 100 | 100 | 100 | 100 | 100 |
| Inventories | 160.7 | 187.7 | 161.7 | 171.2 | 182.4 | 157.6 | 153.1 | 148.8 | 144.6 | 140.5 |
| Inventories, % | 11.71 | 12.76 | 12.75 | 15.26 | 15.23 | 13.54 | 13.54 | 13.54 | 13.54 | 13.54 |
| Accounts Payable | 668.5 | 701.1 | 747.9 | 698.1 | 677.1 | 638.0 | 619.9 | 602.4 | 585.3 | 568.7 |
| Accounts Payable, % | 48.73 | 47.66 | 58.94 | 62.22 | 56.52 | 54.81 | 54.81 | 54.81 | 54.81 | 54.81 |
| Capital Expenditure | -33.7 | -17.1 | -83.8 | -39.9 | -98.5 | -51.2 | -49.8 | -48.4 | -47.0 | -45.7 |
| Capital Expenditure, % | -2.45 | -1.16 | -6.6 | -3.56 | -8.22 | -4.4 | -4.4 | -4.4 | -4.4 | -4.4 |
| Tax Rate, % | 87.29 | 87.29 | 87.29 | 87.29 | 87.29 | 87.29 | 87.29 | 87.29 | 87.29 | 87.29 |
| EBITAT | 98.8 | 125.8 | 82.9 | -439.6 | 8.1 | -2.1 | -2.0 | -2.0 | -1.9 | -1.9 |
| Depreciation | ||||||||||
| Changes in Account Receivables | ||||||||||
| Changes in Inventories | ||||||||||
| Changes in Accounts Payable | ||||||||||
| Capital Expenditure | ||||||||||
| UFCF | -950.7 | -1.2 | 24.4 | -262.6 | 201.6 | 292.7 | 33.3 | 32.3 | 31.4 | 30.5 |
| WACC, % | 9.54 | 9.56 | 9.58 | 9.63 | 9.37 | 9.53 | 9.53 | 9.53 | 9.53 | 9.53 |
| PV UFCF | ||||||||||
| SUM PV UFCF | 360.8 | |||||||||
| Long Term Growth Rate, % | 4.00 | |||||||||
| Free cash flow (T + 1) | 32 | |||||||||
| Terminal Value | 574 | |||||||||
| Present Terminal Value | 364 | |||||||||
| Enterprise Value | 725 | |||||||||
| Net Debt | -510 | |||||||||
| Equity Value | 1,235 | |||||||||
| Diluted Shares Outstanding, MM | 715 | |||||||||
| Equity Value Per Share | 1.73 |
Benefits You Will Receive
- Comprehensive Financial Model: Utilize Jilin Forest Industry’s actual data for accurate DCF valuation.
- Complete Forecast Customization: Modify revenue growth, profit margins, WACC, and other essential factors.
- Real-Time Calculations: Automatic updates provide immediate feedback as you adjust inputs.
- Professional-Grade Template: A polished Excel file crafted for robust valuation.
- Flexible and Reusable: Designed for adaptability, enabling multiple uses for in-depth forecasting.
Key Features
- 🔍 Real-Life Jilin Forest Financials: Pre-populated historical and projected data for Jilin Forest Industry Co., Ltd. (600189SS).
- ✏️ Fully Customizable Inputs: Modify all essential parameters (yellow cells) such as WACC, growth %, and tax rates.
- 📊 Professional DCF Valuation: Integrated formulas assess Jilin Forest’s intrinsic value using the Discounted Cash Flow method.
- ⚡ Instant Results: Quickly visualize Jilin Forest’s valuation after making adjustments.
- Scenario Analysis: Evaluate and contrast outcomes for different financial assumptions side-by-side.
How It Works
- 1. Access the Template: Download and open the Excel file featuring Jilin Forest Industry Co., Ltd.’s preloaded data (600189SS).
- 2. Modify Assumptions: Adjust essential inputs such as growth rates, WACC, and capital expenditures.
- 3. View Results Instantly: The DCF model automatically calculates intrinsic value and NPV in real-time.
- 4. Explore Scenarios: Evaluate various forecasts to understand different valuation outcomes.
- 5. Present with Confidence: Share professional valuation insights to enhance your decision-making process.
Why Choose the Jilin Forest Industry Co., Ltd. (600189SS) Calculator?
- Extensive Functionality: Offers DCF, WACC, and financial ratio assessments all in one platform.
- Personalized Parameters: Modify the yellow-highlighted fields to explore different scenarios.
- In-Depth Analysis: Automatically computes the intrinsic value and Net Present Value for Jilin Forest Industry Co., Ltd.
- Integrated Data: Contains historical and projected data for reliable analysis foundations.
- High-Quality Standards: Perfect for financial analysts, investors, and business consultants seeking professional insights.
Who Can Benefit from This Product?
- Investors: Effectively assess the fair value of Jilin Forest Industry Co., Ltd. (600189SS) prior to making investment choices.
- CFOs: Utilize a professional-grade DCF model for accurate financial reporting and analysis.
- Consultants: Easily modify the template for client-specific valuation reports.
- Entrepreneurs: Acquire valuable insights into financial modeling practices employed by leading firms.
- Educators: Incorporate it as a teaching resource to illustrate various valuation techniques.
Contents of the Template
- Detailed DCF Model: Editable format with comprehensive valuation calculations.
- Actual Financial Data: Jilin Forest Industry Co., Ltd.'s historical and projected financial data preloaded for your analysis.
- Adjustable Variables: Modify WACC, growth rates, and tax assumptions to simulate different scenarios.
- Financial Statements: Complete annual and quarterly breakdowns for enhanced insights.
- Key Financial Ratios: Integrated analysis for assessing profitability, efficiency, and leverage.
- Interactive Dashboard: Visual outputs including charts and tables for clear, actionable insights.
Disclaimer
All information, articles, and product details provided on this website are for general informational and educational purposes only. We do not claim any ownership over, nor do we intend to infringe upon, any trademarks, copyrights, logos, brand names, or other intellectual property mentioned or depicted on this site. Such intellectual property remains the property of its respective owners, and any references here are made solely for identification or informational purposes, without implying any affiliation, endorsement, or partnership.
We make no representations or warranties, express or implied, regarding the accuracy, completeness, or suitability of any content or products presented. Nothing on this website should be construed as legal, tax, investment, financial, medical, or other professional advice. In addition, no part of this site—including articles or product references—constitutes a solicitation, recommendation, endorsement, advertisement, or offer to buy or sell any securities, franchises, or other financial instruments, particularly in jurisdictions where such activity would be unlawful.
All content is of a general nature and may not address the specific circumstances of any individual or entity. It is not a substitute for professional advice or services. Any actions you take based on the information provided here are strictly at your own risk. You accept full responsibility for any decisions or outcomes arising from your use of this website and agree to release us from any liability in connection with your use of, or reliance upon, the content or products found herein.