
|
Grinm Advanced Materials Co., Ltd. (600206.SS) Valoración de DCF |
Completamente Editable: Adáptelo A Sus Necesidades En Excel O Sheets
Diseño Profesional: Plantillas Confiables Y Estándares De La Industria
Predeterminadas Para Un Uso Rápido Y Eficiente
Compatible con MAC / PC, completamente desbloqueado
No Se Necesita Experiencia; Fáciles De Seguir
Grinm Advanced Materials Co., Ltd. (600206.SS) Bundle
¡Agilice su análisis y mejore la precisión con nuestra calculadora DCF (600206SS)! Utilizando datos reales de Grinm Advanced Materials Co., Ltd. y suposiciones personalizables, esta herramienta le permite pronosticar, evaluar y evaluar (600206SS) como un inversor experimentado.
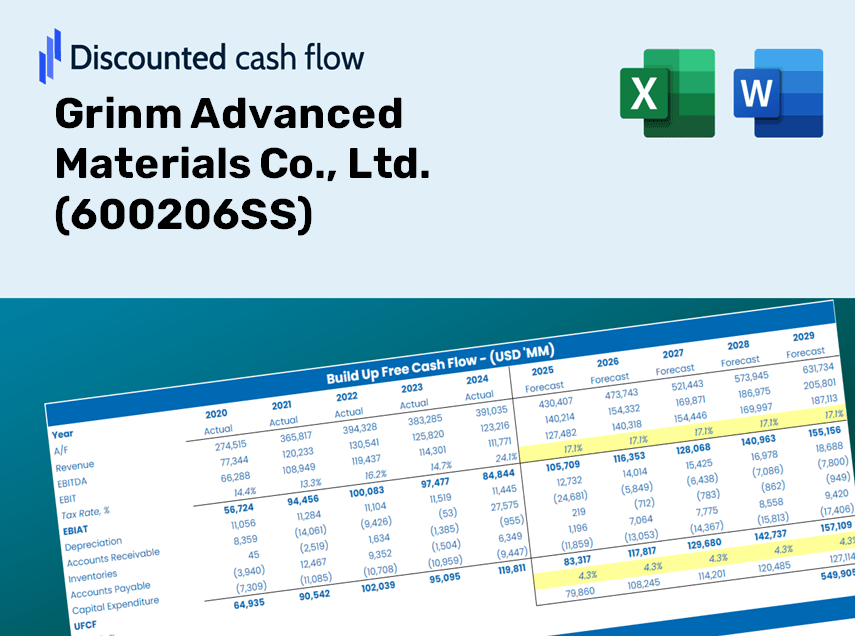
Discounted Cash Flow (DCF) - (USD MM)
| Year | AY1 2020 |
AY2 2021 |
AY3 2022 |
AY4 2023 |
AY5 2024 |
FY1 2025 |
FY2 2026 |
FY3 2027 |
FY4 2028 |
FY5 2029 |
|---|---|---|---|---|---|---|---|---|---|---|
| Revenue | 12,969.0 | 16,058.6 | 15,253.9 | 10,822.1 | 9,145.8 | 8,557.4 | 8,007.0 | 7,491.9 | 7,009.9 | 6,559.0 |
| Revenue Growth, % | 0 | 23.82 | -5.01 | -29.05 | -15.49 | -6.43 | -6.43 | -6.43 | -6.43 | -6.43 |
| EBITDA | 229.1 | 286.5 | 372.3 | 331.7 | 135.1 | 180.3 | 168.7 | 157.8 | 147.7 | 138.2 |
| EBITDA, % | 1.77 | 1.78 | 2.44 | 3.06 | 1.48 | 2.11 | 2.11 | 2.11 | 2.11 | 2.11 |
| Depreciation | 63.3 | 79.1 | 92.4 | 105.8 | 119.9 | 66.3 | 62.1 | 58.1 | 54.3 | 50.8 |
| Depreciation, % | 0.48798 | 0.49265 | 0.60592 | 0.97751 | 1.31 | 0.77502 | 0.77502 | 0.77502 | 0.77502 | 0.77502 |
| EBIT | 165.8 | 207.3 | 279.9 | 225.9 | 15.2 | 113.9 | 106.6 | 99.8 | 93.3 | 87.3 |
| EBIT, % | 1.28 | 1.29 | 1.83 | 2.09 | 0.16588 | 1.33 | 1.33 | 1.33 | 1.33 | 1.33 |
| Total Cash | 835.6 | 1,565.1 | 1,118.6 | 1,956.7 | 1,909.6 | 1,069.4 | 1,000.6 | 936.2 | 876.0 | 819.6 |
| Total Cash, percent | .0 | .0 | .0 | .0 | .0 | .0 | .0 | .0 | .0 | .0 |
| Account Receivables | 588.8 | 569.8 | 693.1 | 822.5 | 1,107.8 | 553.6 | 518.0 | 484.6 | 453.5 | 424.3 |
| Account Receivables, % | 4.54 | 3.55 | 4.54 | 7.6 | 12.11 | 6.47 | 6.47 | 6.47 | 6.47 | 6.47 |
| Inventories | 813.6 | 1,005.2 | 1,191.5 | 1,352.4 | 1,026.2 | 754.1 | 705.6 | 660.2 | 617.7 | 578.0 |
| Inventories, % | 6.27 | 6.26 | 7.81 | 12.5 | 11.22 | 8.81 | 8.81 | 8.81 | 8.81 | 8.81 |
| Accounts Payable | 98.0 | 320.9 | 164.0 | 442.3 | 333.5 | 197.9 | 185.1 | 173.2 | 162.1 | 151.7 |
| Accounts Payable, % | 0.7555 | 2 | 1.07 | 4.09 | 3.65 | 2.31 | 2.31 | 2.31 | 2.31 | 2.31 |
| Capital Expenditure | -202.0 | -133.6 | -301.0 | -246.5 | -97.1 | -131.8 | -123.3 | -115.4 | -108.0 | -101.0 |
| Capital Expenditure, % | -1.56 | -0.83206 | -1.97 | -2.28 | -1.06 | -1.54 | -1.54 | -1.54 | -1.54 | -1.54 |
| Tax Rate, % | -774.4 | -774.4 | -774.4 | -774.4 | -774.4 | -774.4 | -774.4 | -774.4 | -774.4 | -774.4 |
| EBITAT | 130.6 | 167.4 | 230.2 | 195.1 | 132.7 | 97.6 | 91.3 | 85.4 | 79.9 | 74.8 |
| Depreciation | ||||||||||
| Changes in Account Receivables | ||||||||||
| Changes in Inventories | ||||||||||
| Changes in Accounts Payable | ||||||||||
| Capital Expenditure | ||||||||||
| UFCF | -1,312.5 | 163.2 | -444.9 | 42.3 | 87.6 | 722.8 | 101.4 | 94.9 | 88.8 | 83.1 |
| WACC, % | 4.52 | 4.53 | 4.53 | 4.54 | 4.57 | 4.54 | 4.54 | 4.54 | 4.54 | 4.54 |
| PV UFCF | ||||||||||
| SUM PV UFCF | 1,008.0 | |||||||||
| Long Term Growth Rate, % | 2.00 | |||||||||
| Free cash flow (T + 1) | 85 | |||||||||
| Terminal Value | 3,335 | |||||||||
| Present Terminal Value | 2,671 | |||||||||
| Enterprise Value | 3,679 | |||||||||
| Net Debt | -999 | |||||||||
| Equity Value | 4,678 | |||||||||
| Diluted Shares Outstanding, MM | 849 | |||||||||
| Equity Value Per Share | 5.51 |
Benefits You Will Receive
- Customizable Excel Template: A fully editable Excel-based DCF Calculator featuring pre-filled financial data for Grinm Advanced Materials Co., Ltd. (600206SS).
- Comprehensive Data: Access to historical performance metrics and forward-looking projections (highlighted in the yellow cells).
- Adjustable Forecasts: Modify key assumptions such as revenue growth, EBITDA percentage, and WACC as needed.
- Instant Calculations: Quickly observe how your inputs affect the valuation of Grinm Advanced Materials Co., Ltd. (600206SS).
- Professional Resource: Designed for investors, CFOs, consultants, and financial analysts.
- Intuitive Interface: Organized for simplicity and ease of navigation, complete with step-by-step guidance.
Key Features
- 🔍 Real-Life Grinm Financials: Pre-filled historical and projected data for Grinm Advanced Materials Co., Ltd. (600206SS).
- ✏️ Fully Customizable Inputs: Adjust all critical parameters (yellow cells) such as WACC, growth %, and tax rates.
- 📊 Professional DCF Valuation: Built-in formulas calculate Grinm’s intrinsic value using the Discounted Cash Flow method.
- ⚡ Instant Results: Visualize Grinm’s valuation immediately after making adjustments.
- Scenario Analysis: Evaluate and compare outcomes for various financial assumptions side-by-side.
How It Works
- Step 1: Download the Excel file.
- Step 2: Examine the pre-filled data for Grinm Advanced Materials Co., Ltd. (600206SS) (historical and projected).
- Step 3: Modify the key assumptions (highlighted in yellow) according to your analysis.
- Step 4: Observe the automatic recalculations for the intrinsic value of Grinm Advanced Materials Co., Ltd. (600206SS).
- Step 5: Utilize the results for investment decisions or reporting purposes.
Why Opt for This Calculator for Grinm Advanced Materials Co., Ltd. (600206SS)?
- Precise Data: Utilize verified financials from Grinm Advanced Materials for dependable valuation outcomes.
- Tailored Configuration: Modify essential variables such as growth rates, WACC, and tax rates to align with your financial forecasts.
- Efficiency Boost: Ready-to-use calculations save you the hassle of starting from the ground up.
- Expert-Level Tool: Crafted for investors, analysts, and consultants in the materials sector.
- Easy to Navigate: User-friendly design and guided instructions make it accessible for everyone.
Who Should Consider Grinm Advanced Materials Co., Ltd.?
- Investors: Effectively assess the fair value of Grinm Advanced Materials (600206SS) before making investment choices.
- CFOs: Utilize a top-tier DCF model for financial analysis and reporting related to Grinm Advanced Materials.
- Consultants: Easily customize the template for valuation reports tailored to clients involving Grinm Advanced Materials (600206SS).
- Entrepreneurs: Acquire knowledge on financial modeling practices employed by leading companies including Grinm Advanced Materials.
- Educators: Implement it as an educational resource to illustrate various valuation techniques related to Grinm Advanced Materials (600206SS).
Contents of the Template
- Preloaded (600206SS) Data: Historical and projected financial metrics, including revenue, EBIT, and capital expenditures.
- DCF and WACC Models: Professional-grade spreadsheets for determining intrinsic value and Weighted Average Cost of Capital.
- Editable Inputs: Yellow-highlighted fields for modifying revenue growth, tax rates, and discount rates.
- Financial Statements: Detailed annual and quarterly financials for comprehensive analysis.
- Key Ratios: Metrics on profitability, leverage, and efficiency to assess performance.
- Dashboard and Charts: Visual representations of valuation results and underlying assumptions.
Disclaimer
All information, articles, and product details provided on this website are for general informational and educational purposes only. We do not claim any ownership over, nor do we intend to infringe upon, any trademarks, copyrights, logos, brand names, or other intellectual property mentioned or depicted on this site. Such intellectual property remains the property of its respective owners, and any references here are made solely for identification or informational purposes, without implying any affiliation, endorsement, or partnership.
We make no representations or warranties, express or implied, regarding the accuracy, completeness, or suitability of any content or products presented. Nothing on this website should be construed as legal, tax, investment, financial, medical, or other professional advice. In addition, no part of this site—including articles or product references—constitutes a solicitation, recommendation, endorsement, advertisement, or offer to buy or sell any securities, franchises, or other financial instruments, particularly in jurisdictions where such activity would be unlawful.
All content is of a general nature and may not address the specific circumstances of any individual or entity. It is not a substitute for professional advice or services. Any actions you take based on the information provided here are strictly at your own risk. You accept full responsibility for any decisions or outcomes arising from your use of this website and agree to release us from any liability in connection with your use of, or reliance upon, the content or products found herein.