
|
Tibet Rhodiola Pharmaceutical Holding Co. (600211.SS) Valoración de DCF |
Completamente Editable: Adáptelo A Sus Necesidades En Excel O Sheets
Diseño Profesional: Plantillas Confiables Y Estándares De La Industria
Predeterminadas Para Un Uso Rápido Y Eficiente
Compatible con MAC / PC, completamente desbloqueado
No Se Necesita Experiencia; Fáciles De Seguir
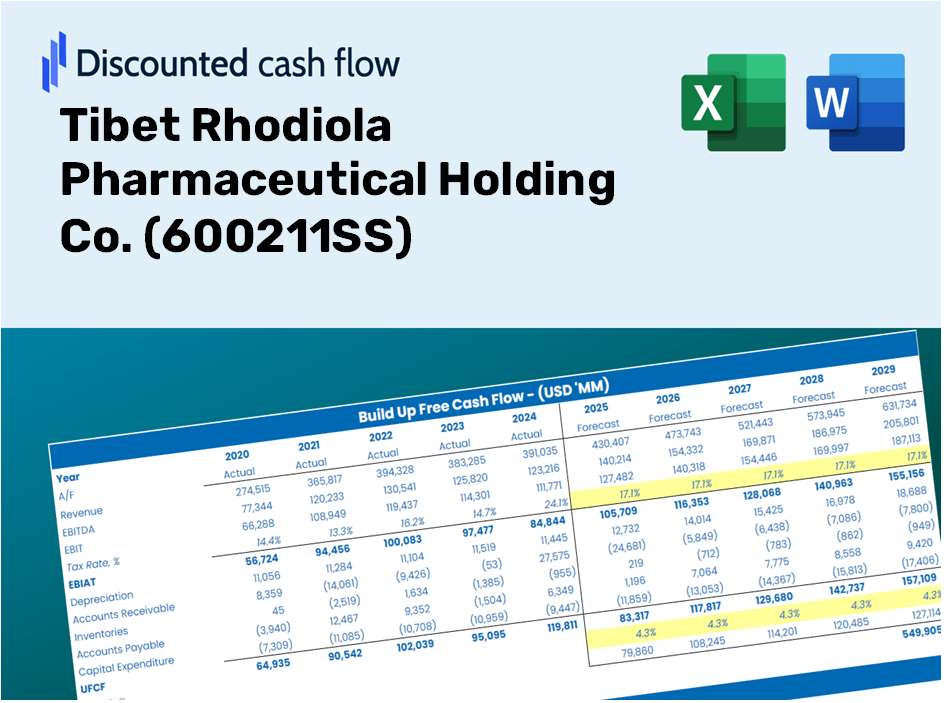
Tibet Rhodiola Pharmaceutical Holding Co. (600211.SS) Bundle
Ya sea que sea un inversionista o analista, esta calculadora DCF (600211SS) es su recurso de referencia para una valoración precisa. Precedidos con datos del Tíbet Rhodiola Pharmaceutical Holding Co., puede ajustar los pronósticos y observar instantáneamente los efectos.
Discounted Cash Flow (DCF) - (USD MM)
| Year | AY1 2020 |
AY2 2021 |
AY3 2022 |
AY4 2023 |
AY5 2024 |
FY1 2025 |
FY2 2026 |
FY3 2027 |
FY4 2028 |
FY5 2029 |
|---|---|---|---|---|---|---|---|---|---|---|
| Revenue | 1,373.1 | 2,138.6 | 2,554.6 | 3,134.3 | 2,806.7 | 3,420.3 | 4,168.0 | 5,079.1 | 6,189.4 | 7,542.5 |
| Revenue Growth, % | 0 | 55.75 | 19.45 | 22.69 | -10.45 | 21.86 | 21.86 | 21.86 | 21.86 | 21.86 |
| EBITDA | 485.0 | 654.2 | 757.5 | 1,106.7 | 967.6 | 1,131.1 | 1,378.3 | 1,679.6 | 2,046.8 | 2,494.2 |
| EBITDA, % | 35.32 | 30.59 | 29.65 | 35.31 | 34.48 | 33.07 | 33.07 | 33.07 | 33.07 | 33.07 |
| Depreciation | 77.6 | 81.4 | 69.2 | 68.0 | 74.2 | 116.2 | 141.6 | 172.6 | 210.3 | 256.2 |
| Depreciation, % | 5.65 | 3.81 | 2.71 | 2.17 | 2.64 | 3.4 | 3.4 | 3.4 | 3.4 | 3.4 |
| EBIT | 407.3 | 572.7 | 688.3 | 1,038.7 | 893.4 | 1,014.9 | 1,236.7 | 1,507.1 | 1,836.5 | 2,238.0 |
| EBIT, % | 29.66 | 26.78 | 26.94 | 33.14 | 31.83 | 29.67 | 29.67 | 29.67 | 29.67 | 29.67 |
| Total Cash | 783.5 | 1,302.3 | 1,932.3 | 2,375.1 | 2,624.8 | 2,482.4 | 3,025.0 | 3,686.3 | 4,492.2 | 5,474.2 |
| Total Cash, percent | .0 | .0 | .0 | .0 | .0 | .0 | .0 | .0 | .0 | .0 |
| Account Receivables | 492.8 | 632.3 | 625.7 | 856.7 | 744.7 | 983.7 | 1,198.8 | 1,460.9 | 1,780.2 | 2,169.4 |
| Account Receivables, % | 35.89 | 29.57 | 24.49 | 27.33 | 26.53 | 28.76 | 28.76 | 28.76 | 28.76 | 28.76 |
| Inventories | 70.9 | 137.3 | 99.9 | 111.4 | 134.2 | 163.0 | 198.6 | 242.1 | 295.0 | 359.5 |
| Inventories, % | 5.16 | 6.42 | 3.91 | 3.56 | 4.78 | 4.77 | 4.77 | 4.77 | 4.77 | 4.77 |
| Accounts Payable | 8.3 | 101.1 | 42.2 | 38.9 | 25.4 | 62.5 | 76.1 | 92.8 | 113.1 | 137.8 |
| Accounts Payable, % | 0.60593 | 4.73 | 1.65 | 1.24 | 0.90533 | 1.83 | 1.83 | 1.83 | 1.83 | 1.83 |
| Capital Expenditure | -221.3 | -425.6 | -102.0 | -21.7 | -37.6 | -287.6 | -350.4 | -427.0 | -520.4 | -634.2 |
| Capital Expenditure, % | -16.12 | -19.9 | -3.99 | -0.69198 | -1.34 | -8.41 | -8.41 | -8.41 | -8.41 | -8.41 |
| Tax Rate, % | 8.75 | 8.75 | 8.75 | 8.75 | 8.75 | 8.75 | 8.75 | 8.75 | 8.75 | 8.75 |
| EBITAT | 362.1 | 469.6 | 549.3 | 926.2 | 815.3 | 875.0 | 1,066.3 | 1,299.4 | 1,583.5 | 1,929.7 |
| Depreciation | ||||||||||
| Changes in Account Receivables | ||||||||||
| Changes in Inventories | ||||||||||
| Changes in Accounts Payable | ||||||||||
| Capital Expenditure | ||||||||||
| UFCF | -336.9 | 12.2 | 501.7 | 726.7 | 927.7 | 472.8 | 620.5 | 756.1 | 921.4 | 1,122.8 |
| WACC, % | 4.51 | 4.51 | 4.51 | 4.51 | 4.51 | 4.51 | 4.51 | 4.51 | 4.51 | 4.51 |
| PV UFCF | ||||||||||
| SUM PV UFCF | 3,355.9 | |||||||||
| Long Term Growth Rate, % | 3.50 | |||||||||
| Free cash flow (T + 1) | 1,162 | |||||||||
| Terminal Value | 115,123 | |||||||||
| Present Terminal Value | 92,339 | |||||||||
| Enterprise Value | 95,695 | |||||||||
| Net Debt | -1,376 | |||||||||
| Equity Value | 97,071 | |||||||||
| Diluted Shares Outstanding, MM | 322 | |||||||||
| Equity Value Per Share | 301.01 |
What You Will Receive
- Authentic (600211SS) Financial Data: Comes pre-loaded with Tibet Rhodiola's historical and forecasted data for accurate analysis.
- Customizable Template: Easily adjust key inputs such as revenue growth, WACC, and EBITDA percentage.
- Instant Calculations: Watch the intrinsic value of (600211SS) update in real-time as you make changes.
- Professional Valuation Tool: Tailored for investors, analysts, and consultants looking for dependable DCF results.
- User-Friendly Layout: Intuitive design and straightforward instructions suitable for all levels of expertise.
Key Features
- 🔍 Real-Life 600211SS Financials: Pre-filled historical and projected data for Tibet Rhodiola Pharmaceutical Holding Co.
- ✏️ Fully Customizable Inputs: Adjust all critical parameters (yellow cells) such as WACC, growth %, and tax rates.
- 📊 Professional DCF Valuation: Built-in formulas compute the intrinsic value of Tibet Rhodiola using the Discounted Cash Flow method.
- ⚡ Instant Results: Visualize the valuation of Tibet Rhodiola immediately after making adjustments.
- Scenario Analysis: Evaluate and compare various financial assumptions side-by-side.
How It Works
- Download the Template: Gain immediate access to the Excel-based Tibet Rhodiola DCF Calculator for (600211SS).
- Input Your Assumptions: Modify the yellow-highlighted cells to set growth rates, WACC, margins, and additional factors.
- Instant Calculations: The model will automatically refresh to reflect Tibet Rhodiola’s intrinsic value.
- Test Scenarios: Experiment with various assumptions to see how they affect potential valuations.
- Analyze and Decide: Leverage the findings to inform your investment strategies or financial analyses.
Why Select This Calculator?
- Designed for Experts: A sophisticated tool utilized by analysts, CFOs, and consultants.
- Relevant Data: Tibet Rhodiola Pharmaceutical's historical and projected financials preloaded for precision.
- Flexible Scenario Analysis: Effortlessly simulate various forecasts and assumptions.
- Streamlined Outputs: Automatically computes intrinsic value, NPV, and essential metrics.
- User-Friendly: Comprehensive step-by-step guidance throughout the process.
Who Should Use This Product?
- Individual Investors: Make informed choices about buying or selling Tibet Rhodiola Pharmaceutical Holding Co. (600211SS) stock.
- Financial Analysts: Enhance valuation processes with comprehensive financial models tailored for this sector.
- Consultants: Provide clients with accurate and timely valuation insights related to Tibet Rhodiola Pharmaceutical Holding Co. (600211SS).
- Business Owners: Gain a deeper understanding of how companies like Tibet Rhodiola Pharmaceutical Holding Co. (600211SS) are valued to inform your own business strategies.
- Finance Students: Master valuation methodologies through practical applications using data from Tibet Rhodiola Pharmaceutical Holding Co. (600211SS).
Contents of the Template
- Preloaded 600211SS Data: Historical and forecasted financial data, including revenue, EBIT, and capital expenditures.
- DCF and WACC Models: Advanced spreadsheets for calculating intrinsic value and Weighted Average Cost of Capital.
- Editable Inputs: Yellow-highlighted cells for modifying revenue growth, tax rates, and discount rates.
- Financial Statements: Detailed annual and quarterly financials for in-depth analysis.
- Key Ratios: Profitability, leverage, and efficiency ratios for performance evaluation.
- Dashboard and Charts: Visual representations of valuation results and underlying assumptions.
Disclaimer
All information, articles, and product details provided on this website are for general informational and educational purposes only. We do not claim any ownership over, nor do we intend to infringe upon, any trademarks, copyrights, logos, brand names, or other intellectual property mentioned or depicted on this site. Such intellectual property remains the property of its respective owners, and any references here are made solely for identification or informational purposes, without implying any affiliation, endorsement, or partnership.
We make no representations or warranties, express or implied, regarding the accuracy, completeness, or suitability of any content or products presented. Nothing on this website should be construed as legal, tax, investment, financial, medical, or other professional advice. In addition, no part of this site—including articles or product references—constitutes a solicitation, recommendation, endorsement, advertisement, or offer to buy or sell any securities, franchises, or other financial instruments, particularly in jurisdictions where such activity would be unlawful.
All content is of a general nature and may not address the specific circumstances of any individual or entity. It is not a substitute for professional advice or services. Any actions you take based on the information provided here are strictly at your own risk. You accept full responsibility for any decisions or outcomes arising from your use of this website and agree to release us from any liability in connection with your use of, or reliance upon, the content or products found herein.