
|
Gresgying Digital Energy Technology Co., Ltd (600212.SS) Valoración de DCF |
Completamente Editable: Adáptelo A Sus Necesidades En Excel O Sheets
Diseño Profesional: Plantillas Confiables Y Estándares De La Industria
Predeterminadas Para Un Uso Rápido Y Eficiente
Compatible con MAC / PC, completamente desbloqueado
No Se Necesita Experiencia; Fáciles De Seguir
Gresgying Digital Energy Technology Co.,Ltd (600212.SS) Bundle
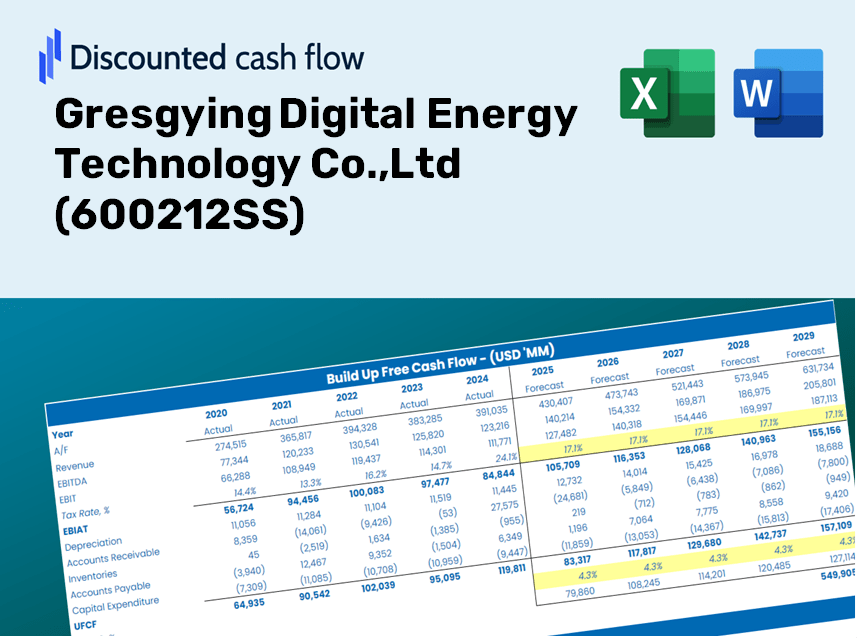
Diseñado para la precisión, nuestra calculadora DCF (600212SS) le permite evaluar Gresgying Digital Energy Technology Co., la valoración de LTD utilizando datos financieros del mundo real y ofrece una flexibilidad completa para modificar todos los parámetros esenciales para mejorar las proyecciones.
Discounted Cash Flow (DCF) - (USD MM)
| Year | AY1 2020 |
AY2 2021 |
AY3 2022 |
AY4 2023 |
AY5 2024 |
FY1 2025 |
FY2 2026 |
FY3 2027 |
FY4 2028 |
FY5 2029 |
|---|---|---|---|---|---|---|---|---|---|---|
| Revenue | 276.8 | 242.8 | 286.4 | 650.5 | 1,015.1 | 1,425.5 | 2,001.8 | 2,811.2 | 3,947.8 | 5,544.0 |
| Revenue Growth, % | 0 | -12.28 | 17.96 | 127.12 | 56.05 | 40.43 | 40.43 | 40.43 | 40.43 | 40.43 |
| EBITDA | 32.1 | -6.4 | -71.8 | 34.9 | 31.3 | -21.9 | -30.7 | -43.2 | -60.6 | -85.1 |
| EBITDA, % | 11.6 | -2.65 | -25.07 | 5.36 | 3.08 | -1.54 | -1.54 | -1.54 | -1.54 | -1.54 |
| Depreciation | 12.5 | 13.5 | 24.1 | 18.2 | 20.1 | 66.4 | 93.2 | 130.9 | 183.8 | 258.1 |
| Depreciation, % | 4.53 | 5.55 | 8.43 | 2.8 | 1.98 | 4.66 | 4.66 | 4.66 | 4.66 | 4.66 |
| EBIT | 19.6 | -19.9 | -95.9 | 16.7 | 11.2 | -88.3 | -123.9 | -174.1 | -244.4 | -343.3 |
| EBIT, % | 7.07 | -8.2 | -33.49 | 2.56 | 1.1 | -6.19 | -6.19 | -6.19 | -6.19 | -6.19 |
| Total Cash | 85.3 | 27.1 | 41.2 | 486.8 | 333.4 | 467.7 | 656.8 | 922.4 | 1,295.3 | 1,819.0 |
| Total Cash, percent | .0 | .0 | .0 | .0 | .0 | .0 | .0 | .0 | .0 | .0 |
| Account Receivables | 46.6 | 80.8 | 252.9 | 403.7 | 740.7 | 779.6 | 1,094.8 | 1,537.4 | 2,159.0 | 3,032.0 |
| Account Receivables, % | 16.85 | 33.28 | 88.3 | 62.06 | 72.97 | 54.69 | 54.69 | 54.69 | 54.69 | 54.69 |
| Inventories | 3.7 | 2.1 | 76.2 | 127.0 | 173.6 | 186.6 | 262.0 | 367.9 | 516.7 | 725.6 |
| Inventories, % | 1.34 | 0.86463 | 26.6 | 19.53 | 17.1 | 13.09 | 13.09 | 13.09 | 13.09 | 13.09 |
| Accounts Payable | 17.8 | 17.7 | 179.6 | 392.0 | 637.3 | 568.7 | 798.7 | 1,121.6 | 1,575.0 | 2,211.8 |
| Accounts Payable, % | 6.44 | 7.27 | 62.72 | 60.27 | 62.79 | 39.9 | 39.9 | 39.9 | 39.9 | 39.9 |
| Capital Expenditure | -17.8 | -8.2 | -13.6 | -74.0 | -22.2 | -80.2 | -112.6 | -158.1 | -222.1 | -311.8 |
| Capital Expenditure, % | -6.43 | -3.36 | -4.76 | -11.38 | -2.19 | -5.62 | -5.62 | -5.62 | -5.62 | -5.62 |
| Tax Rate, % | -40.2 | -40.2 | -40.2 | -40.2 | -40.2 | -40.2 | -40.2 | -40.2 | -40.2 | -40.2 |
| EBITAT | 19.6 | -25.9 | -96.2 | 20.1 | 15.7 | -88.3 | -123.9 | -174.1 | -244.4 | -343.3 |
| Depreciation | ||||||||||
| Changes in Account Receivables | ||||||||||
| Changes in Inventories | ||||||||||
| Changes in Accounts Payable | ||||||||||
| Capital Expenditure | ||||||||||
| UFCF | -18.2 | -53.2 | -169.9 | -24.9 | -124.7 | -222.6 | -304.0 | -427.0 | -599.6 | -842.0 |
| WACC, % | 4.65 | 4.65 | 4.65 | 4.65 | 4.65 | 4.65 | 4.65 | 4.65 | 4.65 | 4.65 |
| PV UFCF | ||||||||||
| SUM PV UFCF | -2,033.6 | |||||||||
| Long Term Growth Rate, % | 2.00 | |||||||||
| Free cash flow (T + 1) | -859 | |||||||||
| Terminal Value | -32,406 | |||||||||
| Present Terminal Value | -25,818 | |||||||||
| Enterprise Value | -27,852 | |||||||||
| Net Debt | -248 | |||||||||
| Equity Value | -27,604 | |||||||||
| Diluted Shares Outstanding, MM | 669 | |||||||||
| Equity Value Per Share | -41.25 |
What You Will Receive
- Accurate GRES Financials: Access to historical and projected data for precise valuation.
- Customizable Inputs: Adjust WACC, tax rates, revenue growth, and capital expenditures as needed.
- Automated Calculations: Dynamic computation of intrinsic value and NPV.
- Scenario Analysis: Evaluate multiple scenarios to assess the future performance of Gresgying Digital Energy Technology Co., Ltd (600212SS).
- User-Friendly Design: Tailored for professionals while remaining approachable for newcomers.
Highlighted Features
- Comprehensive Financial Data: Gain access to precise historical and predictive data for Gresgying Digital Energy Technology Co., Ltd (600212SS).
- Tailored Forecast Parameters: Modify the yellow-highlighted cells that include important metrics such as WACC, growth rates, and margins.
- Real-Time Calculations: Instant updates to DCF, Net Present Value (NPV), and cash flow analyses ensure accuracy.
- Interactive Dashboard: User-friendly charts and summaries that effectively display your valuation findings.
- Designed for All Skill Levels: An accessible and intuitive layout tailored for investors, CFOs, and consultants alike.
How It Works
- Step 1: Download the Excel file.
- Step 2: Examine the pre-filled data for Gresgying Digital Energy Technology Co., Ltd (600212SS) [600212SS], including historical and forecasted figures.
- Step 3: Modify the key assumptions (highlighted in yellow) according to your findings.
- Step 4: Observe the automatic updates for the intrinsic value of Gresgying Digital Energy Technology Co., Ltd (600212SS) [600212SS].
- Step 5: Utilize the results for your investment strategies or reporting needs.
Why Choose Gresgying's Energy Solutions?
- Reliability: Leveraging genuine Gresgying data ensures dependable outcomes.
- Adaptability: Tailored to allow users to customize and experiment with various parameters.
- Efficiency: Eliminate the burden of creating energy models from the ground up.
- Industry-Standard: Crafted with the expertise and insight of seasoned professionals.
- Intuitive: Designed for ease of use, making it accessible for those new to energy technology.
Who Can Benefit from This Product?
- Institutional Investors: Develop comprehensive and accurate valuation models for assessing their portfolios.
- Corporate Finance Departments: Evaluate valuation scenarios to inform strategic decisions within the company.
- Consultants and Financial Advisors: Deliver precise valuation insights for Gresgying Digital Energy Technology Co., Ltd (600212SS) to their clients.
- Students and Instructors: Utilize real-world examples to enhance financial modeling skills in academic settings.
- Industry Analysts: Gain insights into how companies like Gresgying Digital Energy Technology Co., Ltd (600212SS) are valued in the energy technology sector.
Contents of the Template
- Historical Data: Contains Gresgying Digital Energy's previous financials and baseline forecasts.
- DCF and Levered DCF Models: Comprehensive templates for calculating the intrinsic value of Gresgying Digital Energy (600212SS).
- WACC Sheet: Pre-constructed calculations for the Weighted Average Cost of Capital.
- Editable Inputs: Adjust key drivers such as growth rates, EBITDA %, and CAPEX assumptions.
- Quarterly and Annual Statements: A thorough breakdown of Gresgying Digital Energy's financial data.
- Interactive Dashboard: Dynamically visualize valuation outcomes and projections.
Disclaimer
All information, articles, and product details provided on this website are for general informational and educational purposes only. We do not claim any ownership over, nor do we intend to infringe upon, any trademarks, copyrights, logos, brand names, or other intellectual property mentioned or depicted on this site. Such intellectual property remains the property of its respective owners, and any references here are made solely for identification or informational purposes, without implying any affiliation, endorsement, or partnership.
We make no representations or warranties, express or implied, regarding the accuracy, completeness, or suitability of any content or products presented. Nothing on this website should be construed as legal, tax, investment, financial, medical, or other professional advice. In addition, no part of this site—including articles or product references—constitutes a solicitation, recommendation, endorsement, advertisement, or offer to buy or sell any securities, franchises, or other financial instruments, particularly in jurisdictions where such activity would be unlawful.
All content is of a general nature and may not address the specific circumstances of any individual or entity. It is not a substitute for professional advice or services. Any actions you take based on the information provided here are strictly at your own risk. You accept full responsibility for any decisions or outcomes arising from your use of this website and agree to release us from any liability in connection with your use of, or reliance upon, the content or products found herein.