
|
Xinjiang Guannong Fruit & Antler Co., Ltd. (600251.ss) Valoración de DCF |
Completamente Editable: Adáptelo A Sus Necesidades En Excel O Sheets
Diseño Profesional: Plantillas Confiables Y Estándares De La Industria
Predeterminadas Para Un Uso Rápido Y Eficiente
Compatible con MAC / PC, completamente desbloqueado
No Se Necesita Experiencia; Fáciles De Seguir
Xinjiang Guannong Fruit & Antler Co.,Ltd. (600251.SS) Bundle
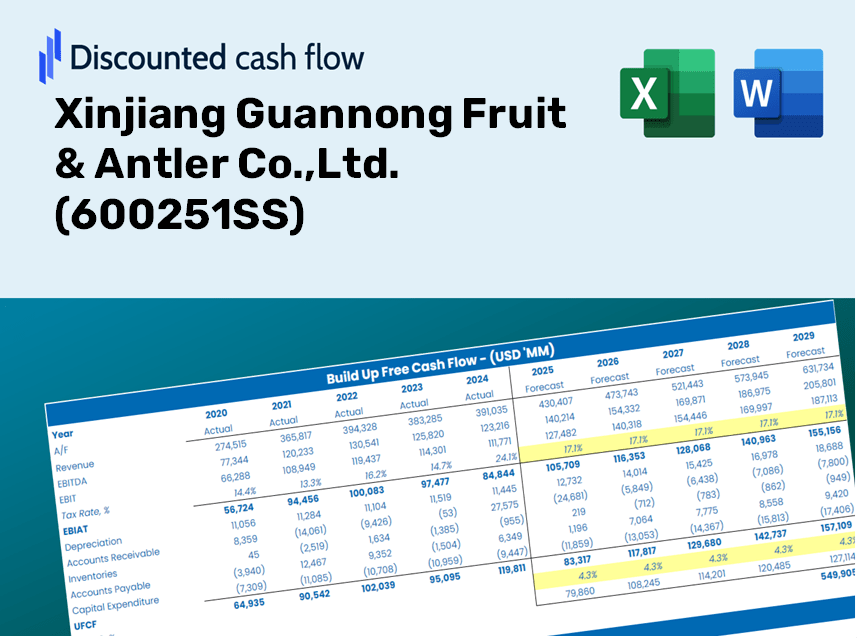
Ya sea que sea un inversor o analista, esta calculadora DCF (600251SS) es su herramienta de referencia para una valoración precisa. Precargados con datos reales de Xinjiang Guannong Fruit & Antler Co., Ltd., puede ajustar fácilmente los pronósticos y observar los efectos en tiempo real.
What You Will Receive
- Authentic Financial Data: Preloaded financials – covering everything from revenue to EBIT – based on real and projected figures for Xinjiang Guannong Fruit & Antler Co., Ltd. (600251SS).
- Comprehensive Customization: Modify all key parameters (highlighted cells) such as WACC, growth rates, and tax percentages.
- Real-Time Valuation Updates: Automatic recalculations to evaluate how changes affect the fair value of Xinjiang Guannong Fruit & Antler Co., Ltd. (600251SS).
- Adaptable Excel Template: Designed for easy edits, scenario analysis, and in-depth projections.
- Efficient and Precise: Avoid building models from the ground up while ensuring accuracy and adaptability.
Featured Highlights
- Accurate Historical Data: Loaded with the historical financial performance and future projections of Xinjiang Guannong Fruit & Antler Co., Ltd. (600251SS).
- Customizable Parameters: Tailor revenue growth, profit margins, discount rates, tax implications, and capital investments.
- Responsive Valuation Framework: Automatically recalculates Net Present Value (NPV) and intrinsic values based on your adjustments.
- Scenario Analysis: Develop various forecasting scenarios to evaluate different valuation results.
- Intuitive Interface: Designed to be accessible and easy to use for both seasoned professionals and newcomers.
How It Functions
- Obtain the Template: Gain immediate access to the Excel-based Xinjiang Guannong Fruit & Antler Co.,Ltd. (600251SS) DCF Calculator.
- Enter Your Assumptions: Modify the yellow-highlighted fields for growth rates, WACC, profit margins, and additional parameters.
- Instant Updates: The model automatically recalculates the intrinsic value of Xinjiang Guannong Fruit & Antler Co.,Ltd. (600251SS).
- Experiment with Scenarios: Test various assumptions to assess potential changes in valuation.
- Evaluate and Decide: Use the findings to inform your investment decisions or financial assessments.
Why Choose This Calculator for Xinjiang Guannong Fruit & Antler Co., Ltd. (600251SS)?
- Reliable Information: Leverage accurate financial data from Xinjiang Guannong for trustworthy valuation outcomes.
- Flexible Options: Tailor essential inputs such as growth rates, WACC, and tax rates to align with your forecasts.
- Efficiency Boost: Pre-configured calculations save you the hassle of building from the ground up.
- Expert-Level Resource: Crafted specifically for investors, analysts, and consultants in the industry.
- Accessible Design: A straightforward interface and guided instructions make it user-friendly for everyone.
Who Can Benefit from This Product?
- Investors: Make informed decisions by accurately assessing the fair value of Xinjiang Guannong Fruit & Antler Co.,Ltd. (600251SS).
- CFOs: Utilize a high-quality DCF model for comprehensive financial reporting and analysis.
- Consultants: Easily tailor the template for creating valuation reports for your clients.
- Entrepreneurs: Discover valuable insights into financial modeling practices used by leading companies.
- Educators: Implement this resource as a teaching aid to illustrate various valuation techniques.
Contents of the Template
- Operating and Balance Sheet Data: Pre-filled historical data and forecasts for Xinjiang Guannong Fruit & Antler Co., Ltd. (600251SS), including revenue, EBITDA, EBIT, and capital expenditures.
- WACC Calculation: A dedicated sheet for calculating the Weighted Average Cost of Capital (WACC), featuring parameters such as Beta, risk-free rate, and share price.
- DCF Valuation (Unlevered and Levered): Customizable Discounted Cash Flow models that demonstrate intrinsic value with comprehensive calculations.
- Financial Statements: Pre-loaded annual and quarterly financial statements to assist in analysis.
- Key Ratios: Provides key profitability, leverage, and efficiency ratios for Xinjiang Guannong Fruit & Antler Co., Ltd. (600251SS).
- Dashboard and Charts: A visual overview of valuation outputs and assumptions to facilitate easy analysis of results.
Disclaimer
All information, articles, and product details provided on this website are for general informational and educational purposes only. We do not claim any ownership over, nor do we intend to infringe upon, any trademarks, copyrights, logos, brand names, or other intellectual property mentioned or depicted on this site. Such intellectual property remains the property of its respective owners, and any references here are made solely for identification or informational purposes, without implying any affiliation, endorsement, or partnership.
We make no representations or warranties, express or implied, regarding the accuracy, completeness, or suitability of any content or products presented. Nothing on this website should be construed as legal, tax, investment, financial, medical, or other professional advice. In addition, no part of this site—including articles or product references—constitutes a solicitation, recommendation, endorsement, advertisement, or offer to buy or sell any securities, franchises, or other financial instruments, particularly in jurisdictions where such activity would be unlawful.
All content is of a general nature and may not address the specific circumstances of any individual or entity. It is not a substitute for professional advice or services. Any actions you take based on the information provided here are strictly at your own risk. You accept full responsibility for any decisions or outcomes arising from your use of this website and agree to release us from any liability in connection with your use of, or reliance upon, the content or products found herein.