
|
Guangxi Wuzhou Zhongheng Group Co., Ltd (600252.SS) Valoración de DCF |
Completamente Editable: Adáptelo A Sus Necesidades En Excel O Sheets
Diseño Profesional: Plantillas Confiables Y Estándares De La Industria
Predeterminadas Para Un Uso Rápido Y Eficiente
Compatible con MAC / PC, completamente desbloqueado
No Se Necesita Experiencia; Fáciles De Seguir
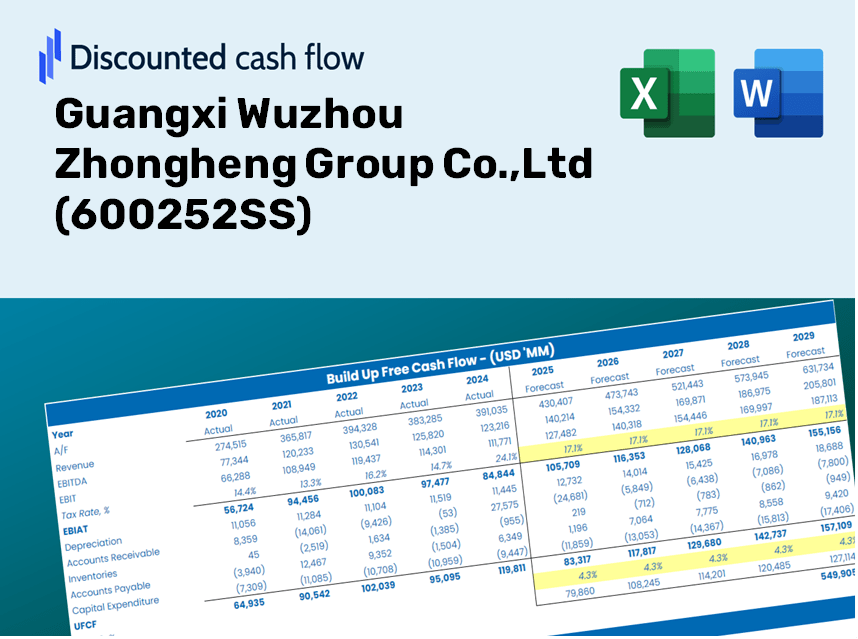
Guangxi Wuzhou Zhongheng Group Co.,Ltd (600252.SS) Bundle
¡Mejore sus opciones de inversión con la calculadora DCF (600252SS)! Explore datos financieros genuinos para Guangxi Wuzhou Zhongheng Group Co., Ltd, ajustar las predicciones y gastos de crecimiento, y observar instantáneamente cómo las variaciones afectan el valor intrínseco de [la empresa].
Discounted Cash Flow (DCF) - (USD MM)
| Year | AY1 2020 |
AY2 2021 |
AY3 2022 |
AY4 2023 |
AY5 2024 |
FY1 2025 |
FY2 2026 |
FY3 2027 |
FY4 2028 |
FY5 2029 |
|---|---|---|---|---|---|---|---|---|---|---|
| Revenue | 3,676.4 | 3,161.8 | 2,713.8 | 3,096.5 | 2,270.8 | 2,039.6 | 1,831.9 | 1,645.4 | 1,477.9 | 1,327.4 |
| Revenue Growth, % | 0 | -14 | -14.17 | 14.1 | -26.67 | -10.18 | -10.18 | -10.18 | -10.18 | -10.18 |
| EBITDA | 504.7 | 249.1 | 165.5 | 182.1 | -33.4 | 131.0 | 117.7 | 105.7 | 94.9 | 85.3 |
| EBITDA, % | 13.73 | 7.88 | 6.1 | 5.88 | -1.47 | 6.42 | 6.42 | 6.42 | 6.42 | 6.42 |
| Depreciation | 176.4 | 183.7 | 181.4 | 184.5 | 155.2 | 122.7 | 110.2 | 99.0 | 88.9 | 79.9 |
| Depreciation, % | 4.8 | 5.81 | 6.68 | 5.96 | 6.83 | 6.02 | 6.02 | 6.02 | 6.02 | 6.02 |
| EBIT | 328.2 | 65.4 | -15.9 | -2.4 | -188.6 | 8.3 | 7.4 | 6.7 | 6.0 | 5.4 |
| EBIT, % | 8.93 | 2.07 | -0.58478 | -0.07616683 | -8.3 | 0.40626 | 0.40626 | 0.40626 | 0.40626 | 0.40626 |
| Total Cash | 3,562.3 | 4,459.7 | 4,200.3 | 3,590.1 | 4,145.0 | 2,026.9 | 1,820.6 | 1,635.2 | 1,468.7 | 1,319.1 |
| Total Cash, percent | .0 | .0 | .0 | .0 | .0 | .0 | .0 | .0 | .0 | .0 |
| Account Receivables | 762.9 | 1,744.0 | 1,748.8 | 931.3 | 1,319.2 | 932.2 | 837.3 | 752.0 | 675.5 | 606.7 |
| Account Receivables, % | 20.75 | 55.16 | 64.44 | 30.08 | 58.09 | 45.7 | 45.7 | 45.7 | 45.7 | 45.7 |
| Inventories | 692.8 | 658.2 | 689.8 | 776.1 | 795.1 | 510.5 | 458.6 | 411.9 | 369.9 | 332.3 |
| Inventories, % | 18.85 | 20.82 | 25.42 | 25.06 | 35.01 | 25.03 | 25.03 | 25.03 | 25.03 | 25.03 |
| Accounts Payable | 715.7 | 525.4 | 431.2 | 529.8 | 503.7 | 372.3 | 334.4 | 300.3 | 269.8 | 242.3 |
| Accounts Payable, % | 19.47 | 16.62 | 15.89 | 17.11 | 22.18 | 18.25 | 18.25 | 18.25 | 18.25 | 18.25 |
| Capital Expenditure | -166.1 | -285.6 | -201.6 | -166.9 | -198.9 | -143.3 | -128.7 | -115.6 | -103.8 | -93.3 |
| Capital Expenditure, % | -4.52 | -9.03 | -7.43 | -5.39 | -8.76 | -7.03 | -7.03 | -7.03 | -7.03 | -7.03 |
| Tax Rate, % | 25.83 | 25.83 | 25.83 | 25.83 | 25.83 | 25.83 | 25.83 | 25.83 | 25.83 | 25.83 |
| EBITAT | 575.0 | 86.7 | -19.7 | -2.4 | -139.8 | 7.9 | 7.1 | 6.3 | 5.7 | 5.1 |
| Depreciation | ||||||||||
| Changes in Account Receivables | ||||||||||
| Changes in Inventories | ||||||||||
| Changes in Accounts Payable | ||||||||||
| Capital Expenditure | ||||||||||
| UFCF | -154.8 | -1,151.8 | -170.6 | 845.0 | -616.6 | 527.5 | 97.6 | 87.6 | 78.7 | 70.7 |
| WACC, % | 4.69 | 4.69 | 4.69 | 4.69 | 4.54 | 4.66 | 4.66 | 4.66 | 4.66 | 4.66 |
| PV UFCF | ||||||||||
| SUM PV UFCF | 791.4 | |||||||||
| Long Term Growth Rate, % | 4.00 | |||||||||
| Free cash flow (T + 1) | 74 | |||||||||
| Terminal Value | 11,118 | |||||||||
| Present Terminal Value | 8,853 | |||||||||
| Enterprise Value | 9,644 | |||||||||
| Net Debt | -2,278 | |||||||||
| Equity Value | 11,923 | |||||||||
| Diluted Shares Outstanding, MM | 3,369 | |||||||||
| Equity Value Per Share | 3.54 |
What You Will Receive
- Adjustable Forecast Inputs: Seamlessly modify key assumptions (growth %, profit margins, WACC) to explore various scenarios.
- Comprehensive Data: Pre-filled financial information for Guangxi Wuzhou Zhongheng Group Co., Ltd (600252SS) to kickstart your analysis.
- Automated DCF Calculations: The model computes Net Present Value (NPV) and intrinsic value automatically.
- Customizable and Professional Design: A refined Excel template tailored to meet your valuation requirements.
- Designed for Analysts and Investors: Perfect for evaluating projections, assessing strategies, and enhancing efficiency.
Key Features
- Customizable Forecast Inputs: Adjust essential parameters such as revenue growth, EBITDA %, and capital expenditures to fit your analysis.
- Instant DCF Valuation: Quickly computes intrinsic value, NPV, and additional metrics with ease.
- High-Precision Accuracy: Leverages Guangxi Wuzhou Zhongheng Group Co., Ltd's (600252SS) actual financial data for trustworthy valuation results.
- Effortless Scenario Analysis: Experiment with various assumptions and effortlessly compare the results.
- Efficiency Booster: Remove the hassle of developing intricate valuation models from the ground up.
How It Operates
- 1. Access the Template: Download and open the Excel file containing the preloaded data for Guangxi Wuzhou Zhongheng Group Co., Ltd (600252SS).
- 2. Modify Assumptions: Adjust key inputs such as growth rates, WACC, and capital expenditures as needed.
- 3. View Results in Real-Time: The DCF model automatically computes intrinsic value and NPV based on your inputs.
- 4. Explore Different Scenarios: Evaluate various forecasts to understand different valuation results.
- 5. Present with Assurance: Share professional valuation insights to inform your decision-making process.
Why Opt for This Calculator?
- All-in-One Solution: Offers DCF, WACC, and financial ratio assessments all in a single platform.
- Adjustable Parameters: Easily modify the yellow-highlighted fields to explore different scenarios.
- In-Depth Analysis: Automatically computes the intrinsic value and Net Present Value for Guangxi Wuzhou Zhongheng Group Co., Ltd (600252SS).
- Ready-to-Use Data: Incorporates historical and projected data to provide reliable starting points.
- High Professional Standard: Perfect for financial analysts, investors, and business consultants.
Who Should Use This Product?
- Investors: Accurately assess the fair value of Guangxi Wuzhou Zhongheng Group Co., Ltd (600252SS) prior to making investment choices.
- CFOs: Utilize a top-tier DCF model for comprehensive financial reporting and analysis.
- Consultants: Efficiently customize the template for client valuation reports.
- Entrepreneurs: Acquire knowledge of financial modeling techniques employed by leading companies.
- Educators: Implement it as an instructional resource to illustrate various valuation methodologies.
Contents of the Template
- Preloaded 600252SS Data: Historical and projected financial information, including revenue, EBIT, and capital expenditures.
- DCF and WACC Models: Professional-grade spreadsheets designed for calculating intrinsic value and Weighted Average Cost of Capital.
- Editable Inputs: Yellow-highlighted cells for customizing revenue growth, tax rates, and discount rates.
- Financial Statements: Detailed annual and quarterly financial reports for thorough analysis.
- Key Ratios: Profitability, leverage, and efficiency ratios to assess company performance.
- Dashboard and Charts: Visual representations of valuation results and underlying assumptions.
Disclaimer
All information, articles, and product details provided on this website are for general informational and educational purposes only. We do not claim any ownership over, nor do we intend to infringe upon, any trademarks, copyrights, logos, brand names, or other intellectual property mentioned or depicted on this site. Such intellectual property remains the property of its respective owners, and any references here are made solely for identification or informational purposes, without implying any affiliation, endorsement, or partnership.
We make no representations or warranties, express or implied, regarding the accuracy, completeness, or suitability of any content or products presented. Nothing on this website should be construed as legal, tax, investment, financial, medical, or other professional advice. In addition, no part of this site—including articles or product references—constitutes a solicitation, recommendation, endorsement, advertisement, or offer to buy or sell any securities, franchises, or other financial instruments, particularly in jurisdictions where such activity would be unlawful.
All content is of a general nature and may not address the specific circumstances of any individual or entity. It is not a substitute for professional advice or services. Any actions you take based on the information provided here are strictly at your own risk. You accept full responsibility for any decisions or outcomes arising from your use of this website and agree to release us from any liability in connection with your use of, or reliance upon, the content or products found herein.