
|
Inversión de construcción urbana de Beijing & Development Co., Ltd. (600266.SS) Valoración de DCF |
Completamente Editable: Adáptelo A Sus Necesidades En Excel O Sheets
Diseño Profesional: Plantillas Confiables Y Estándares De La Industria
Predeterminadas Para Un Uso Rápido Y Eficiente
Compatible con MAC / PC, completamente desbloqueado
No Se Necesita Experiencia; Fáciles De Seguir
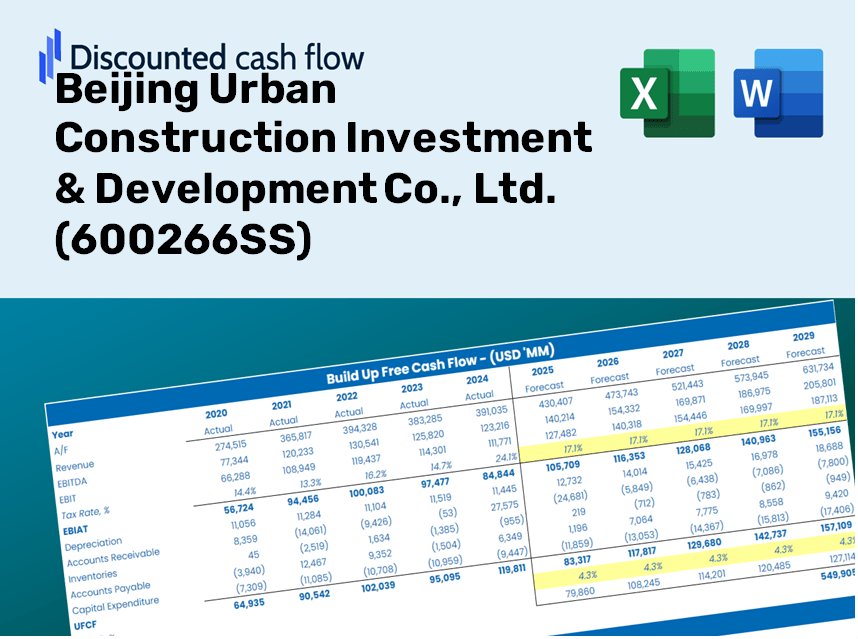
Beijing Urban Construction Investment & Development Co., Ltd. (600266.SS) Bundle
Explore la perspectiva financiera de Beijing Urban Construction Investment & ¡Desarrollo Co., Ltd. (600266SS) con nuestra calculadora DCF fácil de usar! Ingrese sus proyecciones para el crecimiento, los márgenes y los gastos para calcular el valor intrínseco de la inversión de construcción urbana de Beijing & Development Co., Ltd. (600266SS) y mejora su estrategia de inversión.
Discounted Cash Flow (DCF) - (USD MM)
| Year | AY1 2020 |
AY2 2021 |
AY3 2022 |
AY4 2023 |
AY5 2024 |
FY1 2025 |
FY2 2026 |
FY3 2027 |
FY4 2028 |
FY5 2029 |
|---|---|---|---|---|---|---|---|---|---|---|
| Revenue | 13,890.9 | 24,184.3 | 24,561.9 | 20,363.0 | 25,442.2 | 30,754.0 | 37,174.7 | 44,936.0 | 54,317.7 | 65,658.1 |
| Revenue Growth, % | 0 | 74.1 | 1.56 | -17.09 | 24.94 | 20.88 | 20.88 | 20.88 | 20.88 | 20.88 |
| EBITDA | 1,927.1 | 2,404.5 | 1,117.6 | 599.8 | -770.0 | 1,739.8 | 2,103.0 | 2,542.1 | 3,072.8 | 3,714.3 |
| EBITDA, % | 13.87 | 9.94 | 4.55 | 2.95 | -3.03 | 5.66 | 5.66 | 5.66 | 5.66 | 5.66 |
| Depreciation | 33.1 | 31.1 | 31.1 | 29.5 | 28.0 | 46.1 | 55.7 | 67.3 | 81.3 | 98.3 |
| Depreciation, % | 0.23857 | 0.12874 | 0.12665 | 0.14475 | 0.11 | 0.14975 | 0.14975 | 0.14975 | 0.14975 | 0.14975 |
| EBIT | 1,894.0 | 2,373.4 | 1,086.5 | 570.3 | -798.0 | 1,693.7 | 2,047.3 | 2,474.8 | 2,991.5 | 3,616.0 |
| EBIT, % | 13.63 | 9.81 | 4.42 | 2.8 | -3.14 | 5.51 | 5.51 | 5.51 | 5.51 | 5.51 |
| Total Cash | 15,204.2 | 17,405.8 | 16,437.5 | 16,101.8 | 12,779.3 | 22,647.0 | 27,375.3 | 33,090.6 | 39,999.3 | 48,350.2 |
| Total Cash, percent | .0 | .0 | .0 | .0 | .0 | .0 | .0 | .0 | .0 | .0 |
| Account Receivables | 131.0 | 6,804.2 | 317.9 | 8,680.6 | 8,325.8 | 6,503.0 | 7,860.6 | 9,501.8 | 11,485.5 | 13,883.5 |
| Account Receivables, % | 0.94335 | 28.13 | 1.29 | 42.63 | 32.72 | 21.15 | 21.15 | 21.15 | 21.15 | 21.15 |
| Inventories | 86,876.0 | 91,301.0 | 95,838.1 | 91,219.8 | 77,594.6 | 30,754.0 | 37,174.7 | 44,936.0 | 54,317.7 | 65,658.1 |
| Inventories, % | 625.42 | 377.52 | 390.19 | 447.97 | 304.98 | 100 | 100 | 100 | 100 | 100 |
| Accounts Payable | 9,381.7 | 10,364.6 | 11,907.0 | 12,524.2 | 11,499.7 | 16,335.1 | 19,745.5 | 23,868.0 | 28,851.1 | 34,874.6 |
| Accounts Payable, % | 67.54 | 42.86 | 48.48 | 61.5 | 45.2 | 53.12 | 53.12 | 53.12 | 53.12 | 53.12 |
| Capital Expenditure | -96.4 | -184.0 | -143.7 | -109.0 | -70.6 | -175.4 | -212.1 | -256.4 | -309.9 | -374.6 |
| Capital Expenditure, % | -0.69392 | -0.7608 | -0.58511 | -0.53505 | -0.27753 | -0.57048 | -0.57048 | -0.57048 | -0.57048 | -0.57048 |
| Tax Rate, % | 27.82 | 27.82 | 27.82 | 27.82 | 27.82 | 27.82 | 27.82 | 27.82 | 27.82 | 27.82 |
| EBITAT | 1,554.6 | 1,070.8 | 1,358.9 | 561.5 | -576.0 | 1,347.6 | 1,629.0 | 1,969.1 | 2,380.2 | 2,877.1 |
| Depreciation | ||||||||||
| Changes in Account Receivables | ||||||||||
| Changes in Inventories | ||||||||||
| Changes in Accounts Payable | ||||||||||
| Capital Expenditure | ||||||||||
| UFCF | -76,134.0 | -9,197.3 | 4,737.9 | -2,645.2 | 12,336.8 | 54,717.1 | -2,895.5 | -3,500.0 | -4,230.7 | -5,114.0 |
| WACC, % | 4.29 | 3.27 | 4.78 | 4.74 | 4.02 | 4.22 | 4.22 | 4.22 | 4.22 | 4.22 |
| PV UFCF | ||||||||||
| SUM PV UFCF | 38,999.0 | |||||||||
| Long Term Growth Rate, % | 2.00 | |||||||||
| Free cash flow (T + 1) | -5,216 | |||||||||
| Terminal Value | -235,191 | |||||||||
| Present Terminal Value | -191,298 | |||||||||
| Enterprise Value | -152,299 | |||||||||
| Net Debt | 19,494 | |||||||||
| Equity Value | -171,793 | |||||||||
| Diluted Shares Outstanding, MM | 1,722 | |||||||||
| Equity Value Per Share | -99.78 |
What You Will Receive
- Authentic Beijing Urban Data: Preloaded financial metrics – including revenue and EBIT – derived from actual and projected statistics.
- Comprehensive Customization: Modify all essential parameters (highlighted cells) such as WACC, growth percentages, and tax rates.
- Immediate Valuation Adjustments: Automatic recalculations to assess the impact of changes on the fair value of Beijing Urban Construction Investment & Development Co., Ltd. (600266SS).
- Flexible Excel Template: Designed for rapid modifications, scenario analysis, and in-depth forecasts.
- Efficient and Precise: Eliminate the need to construct models from scratch while ensuring accuracy and adaptability.
Key Features
- Comprehensive DCF Model: Offers detailed unlevered and levered DCF valuation frameworks tailored for Beijing Urban Construction Investment & Development Co., Ltd. (600266SS).
- WACC Estimator: Features a pre-designed Weighted Average Cost of Capital sheet with adjustable parameters.
- Customizable Forecast Inputs: Easily adjust growth projections, capital investments, and discount rates.
- Integrated Financial Metrics: Evaluate profitability, leverage, and efficiency ratios specifically for Beijing Urban Construction Investment & Development Co., Ltd. (600266SS).
- Visual Dashboard and Graphs: Graphical representations that summarize essential valuation metrics for streamlined analysis.
How It Works
- Download the Template: Gain immediate access to the Excel-based (600266SS) DCF Calculator.
- Input Your Assumptions: Customize the yellow-highlighted cells with your growth rates, WACC, margins, and other variables.
- Instant Calculations: The model will automatically calculate the intrinsic value of Beijing Urban Construction Investment & Development Co., Ltd.
- Test Scenarios: Explore different assumptions to assess potential changes in valuation.
- Analyze and Decide: Utilize the results to inform your investment or financial analysis.
Why Choose This Calculator for Beijing Urban Construction Investment & Development Co., Ltd. (600266SS)?
- Accurate Data: Utilize real financial figures from Beijing Urban Construction for dependable valuation outcomes.
- Customizable: Fine-tune essential parameters such as growth rates, WACC, and tax rates to align with your projections.
- Time-Saving: Ready-made calculations streamline the process, eliminating the need to start from ground zero.
- Professional-Grade Tool: Tailored for investors, analysts, and consultants focused on the construction sector.
- User-Friendly: An intuitive design and clear, step-by-step guidance make it accessible for all users.
Who Can Benefit from Our Services?
- Investors: Gain insights and make informed decisions with our comprehensive investment analysis tools.
- Financial Analysts: Streamline your workflow with customizable financial models tailored to your needs.
- Consultants: Effortlessly modify our templates for impactful client presentations and strategic reports.
- Finance Enthusiasts: Enhance your knowledge of urban development financing through practical examples and case studies.
- Educators and Students: Utilize our resources as effective teaching aids in finance and investment courses.
Contents of the Template
- Historical Data: Comprises past financial performance and foundational forecasts for Beijing Urban Construction Investment & Development Co., Ltd. (600266SS).
- DCF and Levered DCF Models: Comprehensive templates for determining the intrinsic value of Beijing Urban Construction Investment & Development Co., Ltd. (600266SS).
- WACC Sheet: Preconfigured calculations for the Weighted Average Cost of Capital.
- Editable Inputs: Customize key metrics such as growth rates, EBITDA percentages, and CAPEX assumptions.
- Quarterly and Annual Statements: An exhaustive overview of the financials for Beijing Urban Construction Investment & Development Co., Ltd. (600266SS).
- Interactive Dashboard: Dynamically visualize valuation outcomes and projections.
Disclaimer
All information, articles, and product details provided on this website are for general informational and educational purposes only. We do not claim any ownership over, nor do we intend to infringe upon, any trademarks, copyrights, logos, brand names, or other intellectual property mentioned or depicted on this site. Such intellectual property remains the property of its respective owners, and any references here are made solely for identification or informational purposes, without implying any affiliation, endorsement, or partnership.
We make no representations or warranties, express or implied, regarding the accuracy, completeness, or suitability of any content or products presented. Nothing on this website should be construed as legal, tax, investment, financial, medical, or other professional advice. In addition, no part of this site—including articles or product references—constitutes a solicitation, recommendation, endorsement, advertisement, or offer to buy or sell any securities, franchises, or other financial instruments, particularly in jurisdictions where such activity would be unlawful.
All content is of a general nature and may not address the specific circumstances of any individual or entity. It is not a substitute for professional advice or services. Any actions you take based on the information provided here are strictly at your own risk. You accept full responsibility for any decisions or outcomes arising from your use of this website and agree to release us from any liability in connection with your use of, or reliance upon, the content or products found herein.