
|
Henan Lingrui Pharmaceutical Co., Ltd. (600285.ss) Valoración de DCF |
Completamente Editable: Adáptelo A Sus Necesidades En Excel O Sheets
Diseño Profesional: Plantillas Confiables Y Estándares De La Industria
Predeterminadas Para Un Uso Rápido Y Eficiente
Compatible con MAC / PC, completamente desbloqueado
No Se Necesita Experiencia; Fáciles De Seguir
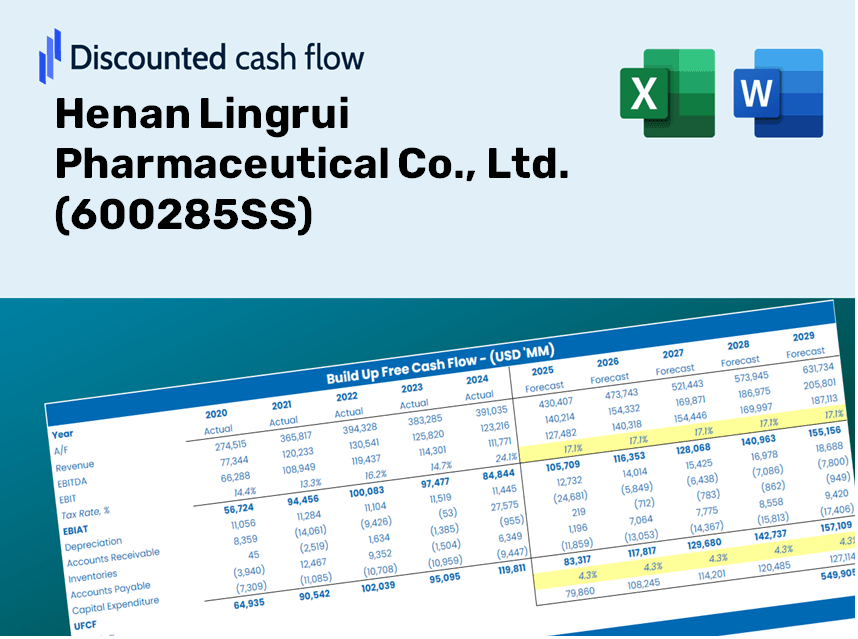
Henan Lingrui Pharmaceutical Co., Ltd. (600285.SS) Bundle
¡Mejore sus opciones de inversión con la calculadora DCF (600285SS)! Utilice datos financieros reales de Henan Lingrui Pharmaceutical Co., Ltd., ajuste las predicciones y gastos de crecimiento, y observe instantáneamente cómo estas alteraciones afectan el valor intrínseco de (600285SS).
Discounted Cash Flow (DCF) - (USD MM)
| Year | AY1 2020 |
AY2 2021 |
AY3 2022 |
AY4 2023 |
AY5 2024 |
FY1 2025 |
FY2 2026 |
FY3 2027 |
FY4 2028 |
FY5 2029 |
|---|---|---|---|---|---|---|---|---|---|---|
| Revenue | 2,331.6 | 2,693.5 | 3,001.9 | 3,311.5 | 3,500.8 | 3,762.2 | 4,043.0 | 4,344.9 | 4,669.2 | 5,017.8 |
| Revenue Growth, % | 0 | 15.52 | 11.45 | 10.31 | 5.72 | 7.47 | 7.47 | 7.47 | 7.47 | 7.47 |
| EBITDA | 384.7 | 447.6 | 463.4 | 664.7 | 795.5 | 687.4 | 738.7 | 793.8 | 853.1 | 916.8 |
| EBITDA, % | 16.5 | 16.62 | 15.44 | 20.07 | 22.72 | 18.27 | 18.27 | 18.27 | 18.27 | 18.27 |
| Depreciation | 68.5 | 71.2 | 74.3 | 75.8 | 71.7 | 93.3 | 100.2 | 107.7 | 115.7 | 124.4 |
| Depreciation, % | 2.94 | 2.64 | 2.48 | 2.29 | 2.05 | 2.48 | 2.48 | 2.48 | 2.48 | 2.48 |
| EBIT | 316.2 | 376.5 | 389.1 | 588.9 | 723.7 | 594.1 | 638.5 | 686.1 | 737.3 | 792.4 |
| EBIT, % | 13.56 | 13.98 | 12.96 | 17.78 | 20.67 | 15.79 | 15.79 | 15.79 | 15.79 | 15.79 |
| Total Cash | 789.5 | 1,081.4 | 1,329.7 | 1,499.1 | 1,511.4 | 1,555.7 | 1,671.8 | 1,796.6 | 1,930.7 | 2,074.9 |
| Total Cash, percent | .0 | .0 | .0 | .0 | .0 | .0 | .0 | .0 | .0 | .0 |
| Account Receivables | 708.6 | 431.2 | 512.0 | 510.9 | 495.2 | 700.0 | 752.2 | 808.4 | 868.7 | 933.6 |
| Account Receivables, % | 30.39 | 16.01 | 17.06 | 15.43 | 14.14 | 18.61 | 18.61 | 18.61 | 18.61 | 18.61 |
| Inventories | 331.4 | 428.4 | 486.4 | 467.4 | 435.0 | 548.2 | 589.2 | 633.1 | 680.4 | 731.2 |
| Inventories, % | 14.21 | 15.9 | 16.2 | 14.11 | 12.42 | 14.57 | 14.57 | 14.57 | 14.57 | 14.57 |
| Accounts Payable | 78.8 | 78.0 | 68.0 | 57.4 | 85.1 | 95.6 | 102.7 | 110.4 | 118.7 | 127.5 |
| Accounts Payable, % | 3.38 | 2.9 | 2.27 | 1.73 | 2.43 | 2.54 | 2.54 | 2.54 | 2.54 | 2.54 |
| Capital Expenditure | -71.8 | -76.9 | -27.0 | -21.2 | -115.1 | -81.0 | -87.0 | -93.5 | -100.5 | -108.0 |
| Capital Expenditure, % | -3.08 | -2.86 | -0.89924 | -0.64014 | -3.29 | -2.15 | -2.15 | -2.15 | -2.15 | -2.15 |
| Tax Rate, % | 12.69 | 12.69 | 12.69 | 12.69 | 12.69 | 12.69 | 12.69 | 12.69 | 12.69 | 12.69 |
| EBITAT | 282.6 | 329.3 | 350.1 | 512.3 | 631.9 | 524.2 | 563.3 | 605.3 | 650.5 | 699.1 |
| Depreciation | ||||||||||
| Changes in Account Receivables | ||||||||||
| Changes in Inventories | ||||||||||
| Changes in Accounts Payable | ||||||||||
| Capital Expenditure | ||||||||||
| UFCF | -682.0 | 503.2 | 248.7 | 576.5 | 664.3 | 228.9 | 490.4 | 527.0 | 566.4 | 608.7 |
| WACC, % | 4.53 | 4.53 | 4.53 | 4.53 | 4.53 | 4.53 | 4.53 | 4.53 | 4.53 | 4.53 |
| PV UFCF | ||||||||||
| SUM PV UFCF | 2,091.4 | |||||||||
| Long Term Growth Rate, % | 3.00 | |||||||||
| Free cash flow (T + 1) | 627 | |||||||||
| Terminal Value | 40,981 | |||||||||
| Present Terminal Value | 32,838 | |||||||||
| Enterprise Value | 34,930 | |||||||||
| Net Debt | -1,189 | |||||||||
| Equity Value | 36,118 | |||||||||
| Diluted Shares Outstanding, MM | 564 | |||||||||
| Equity Value Per Share | 64.03 |
Benefits You Will Experience
- Accurate 600285SS Financial Data: Access both historical and projected figures for precise valuation.
- Customizable Parameters: Adjust WACC, tax rates, revenue growth, and capital expenditures to suit your analysis.
- Real-Time Calculations: Get dynamic assessments of intrinsic value and NPV.
- Comprehensive Scenario Analysis: Evaluate various scenarios to forecast Henan Lingrui Pharmaceutical's future performance.
- User-Friendly Interface: Designed for professionals while remaining easy for newcomers to navigate.
Key Features
- Comprehensive Historical Data: Leveraging Henan Lingrui Pharmaceutical’s past financial metrics and future growth predictions.
- Fully Customizable Variables: Tailor revenue growth rates, profit margins, WACC, tax rates, and capital expenditure assumptions.
- Dynamic Valuation Framework: Automatic recalculation of Net Present Value (NPV) and intrinsic value based on your customized inputs.
- Scenario Analysis: Develop multiple forecasting scenarios to evaluate varying valuation results.
- User-Centric Interface: Intuitive and structured design suitable for both seasoned professionals and newcomers.
How It Works
- Step 1: Download the Excel spreadsheet.
- Step 2: Examine the pre-filled data for Henan Lingrui Pharmaceutical Co., Ltd. (600285SS) (historical and projected).
- Step 3: Modify the key assumptions (yellow cells) according to your analysis.
- Step 4: Observe the automatic recalculations of Henan Lingrui Pharmaceutical Co., Ltd.'s (600285SS) intrinsic value.
- Step 5: Leverage the results for your investment decisions or reporting purposes.
Why Choose This Calculator for Henan Lingrui Pharmaceutical Co., Ltd. (600285SS)?
- Accurate Data: Access real financial figures from Henan Lingrui for dependable valuation outcomes.
- Customizable: Modify essential variables such as growth rates, WACC, and tax rates to align with your forecasts.
- Time-Saving: Built-in calculations streamline your process, so you don't have to start from scratch.
- Professional-Grade Tool: Tailored for investors, analysts, and consultants in the pharmaceutical industry.
- User-Friendly: An intuitive design and guided instructions ensure accessibility for all users.
Who Should Utilize This Product?
- Investors: Assess the fair value of Henan Lingrui Pharmaceutical Co., Ltd. (600285SS) accurately before making investment choices.
- CFOs: Utilize a high-quality DCF model for financial analysis and reporting relevant to (600285SS).
- Consultants: Efficiently customize the template for valuation reports tailored to clients of (600285SS).
- Entrepreneurs: Acquire insights into the financial modeling practices applied by leading pharmaceutical companies.
- Educators: Employ it as a resource for teaching valuation techniques in pharmaceutical finance.
Contents of the Template
- Comprehensive DCF Model: An editable template featuring detailed valuation calculations.
- Real-World Data: Henan Lingrui Pharmaceutical Co., Ltd.'s (600285SS) historical and projected financials preloaded for thorough analysis.
- Customizable Parameters: Modify WACC, growth rates, and tax assumptions to explore various scenarios.
- Financial Statements: Complete annual and quarterly breakdowns for enhanced insights.
- Key Ratios: Integrated analysis focusing on profitability, efficiency, and leverage metrics.
- Dashboard with Visual Outputs: Charts and tables designed for clear, actionable insights.
Disclaimer
All information, articles, and product details provided on this website are for general informational and educational purposes only. We do not claim any ownership over, nor do we intend to infringe upon, any trademarks, copyrights, logos, brand names, or other intellectual property mentioned or depicted on this site. Such intellectual property remains the property of its respective owners, and any references here are made solely for identification or informational purposes, without implying any affiliation, endorsement, or partnership.
We make no representations or warranties, express or implied, regarding the accuracy, completeness, or suitability of any content or products presented. Nothing on this website should be construed as legal, tax, investment, financial, medical, or other professional advice. In addition, no part of this site—including articles or product references—constitutes a solicitation, recommendation, endorsement, advertisement, or offer to buy or sell any securities, franchises, or other financial instruments, particularly in jurisdictions where such activity would be unlawful.
All content is of a general nature and may not address the specific circumstances of any individual or entity. It is not a substitute for professional advice or services. Any actions you take based on the information provided here are strictly at your own risk. You accept full responsibility for any decisions or outcomes arising from your use of this website and agree to release us from any liability in connection with your use of, or reliance upon, the content or products found herein.