
|
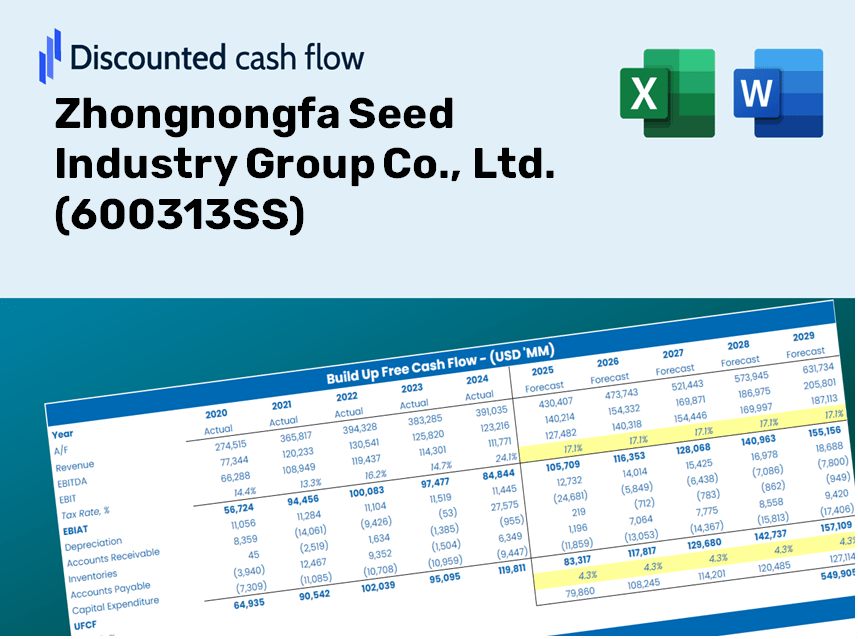
Zhongnongfa Seed Industry Group Co., Ltd. (600313.ss) Valoración de DCF |
Completamente Editable: Adáptelo A Sus Necesidades En Excel O Sheets
Diseño Profesional: Plantillas Confiables Y Estándares De La Industria
Predeterminadas Para Un Uso Rápido Y Eficiente
Compatible con MAC / PC, completamente desbloqueado
No Se Necesita Experiencia; Fáciles De Seguir
Zhongnongfa Seed Industry Group Co., Ltd. (600313.SS) Bundle
Diseñada para la precisión, nuestra calculadora DCF (600313SS) le permite evaluar Zhongnongfa Seed Industry Group Co., Ltd. Valoración utilizando datos financieros del mundo real, que ofrece una flexibilidad completa para modificar todos los parámetros esenciales para las proyecciones mejoradas.
What You'll Receive
- Comprehensive Financial Model: Leverage Zhongnongfa's actual data for accurate DCF valuation.
- Complete Forecast Customization: Modify revenue growth, profit margins, WACC, and other critical factors.
- Real-Time Calculations: Automatic updates provide immediate feedback as you adjust inputs.
- Professional-Grade Template: A polished Excel file specifically designed for investor-ready valuations.
- Flexible and Reusable: Crafted for adaptability, allowing you to easily conduct detailed forecasts multiple times.
Key Features
- Comprehensive Financial Data: Gain access to reliable, pre-loaded historical performance metrics and future forecasts for Zhongnongfa Seed Industry Group Co., Ltd. (600313SS).
- Customizable Assumptions: Modify highlighted cells such as WACC, growth rates, and profit margins to suit your analysis needs.
- Real-Time Calculations: Enjoy automatic updates for DCF, Net Present Value (NPV), and cash flow assessments.
- User-Friendly Dashboard: View easy-to-understand charts and summaries to help visualize your valuation outcomes.
- Designed for All Users: An intuitive layout created for investors, CFOs, and consultants, regardless of experience level.
How It Functions
- Download: Obtain the user-friendly Excel file containing Zhongnongfa Seed Industry Group Co., Ltd.'s (600313SS) financial data.
- Customize: Modify forecasts such as revenue growth, EBITDA %, and WACC to fit your analysis.
- Automatic Updates: The intrinsic value and NPV calculations refresh in real-time as you make adjustments.
- Scenario Testing: Generate various projections and instantly compare the results.
- Informed Decisions: Leverage the valuation outputs to shape your investment strategy.
Why Opt for Zhongnongfa Seed Industry Group's Calculator?
- Time-Saving: No need to build a DCF model from the ground up – it's ready for immediate use.
- Enhanced Accuracy: Dependable financial data and formulas minimize valuation errors.
- Fully Adjustable: Customize the model to suit your own assumptions and forecasts.
- User-Friendly: Intuitive charts and outputs make analyzing results straightforward.
- Endorsed by Professionals: Crafted for experts who prioritize precision and functionality.
Who Should Use This Product?
- Investors: Evaluate the fair value of Zhongnongfa Seed Industry Group Co., Ltd. (600313SS) to inform your investment strategies.
- CFOs: Utilize a comprehensive DCF model for enhanced financial reporting and analysis.
- Consultants: Easily customize the template for client valuation reports focused on the agricultural sector.
- Entrepreneurs: Discover financial modeling techniques employed by leading agricultural firms.
- Educators: Implement it as a learning resource to illustrate valuation methods in finance courses.
Overview of Template Features
- Preloaded 600313SS Data: Comprehensive historical and forecasted financial metrics, including revenue, EBIT, and capital expenditures.
- DCF and WACC Models: High-quality worksheets designed for calculating intrinsic value and Weighted Average Cost of Capital.
- Customizable Inputs: Cells highlighted in yellow for easy modification of revenue growth, tax rates, and discount rates.
- Financial Statements: Detailed annual and quarterly financial reports for in-depth analysis.
- Key Ratios: Metrics for profitability, leverage, and efficiency to assess company performance.
- Dashboard and Graphs: Visual representations of valuation results and underlying assumptions.
Disclaimer
All information, articles, and product details provided on this website are for general informational and educational purposes only. We do not claim any ownership over, nor do we intend to infringe upon, any trademarks, copyrights, logos, brand names, or other intellectual property mentioned or depicted on this site. Such intellectual property remains the property of its respective owners, and any references here are made solely for identification or informational purposes, without implying any affiliation, endorsement, or partnership.
We make no representations or warranties, express or implied, regarding the accuracy, completeness, or suitability of any content or products presented. Nothing on this website should be construed as legal, tax, investment, financial, medical, or other professional advice. In addition, no part of this site—including articles or product references—constitutes a solicitation, recommendation, endorsement, advertisement, or offer to buy or sell any securities, franchises, or other financial instruments, particularly in jurisdictions where such activity would be unlawful.
All content is of a general nature and may not address the specific circumstances of any individual or entity. It is not a substitute for professional advice or services. Any actions you take based on the information provided here are strictly at your own risk. You accept full responsibility for any decisions or outcomes arising from your use of this website and agree to release us from any liability in connection with your use of, or reliance upon, the content or products found herein.