
|
CNSIG Inner Mongolia Chemical Industry Co., Ltd. (600328.SS) Valoración de DCF |
Completamente Editable: Adáptelo A Sus Necesidades En Excel O Sheets
Diseño Profesional: Plantillas Confiables Y Estándares De La Industria
Predeterminadas Para Un Uso Rápido Y Eficiente
Compatible con MAC / PC, completamente desbloqueado
No Se Necesita Experiencia; Fáciles De Seguir
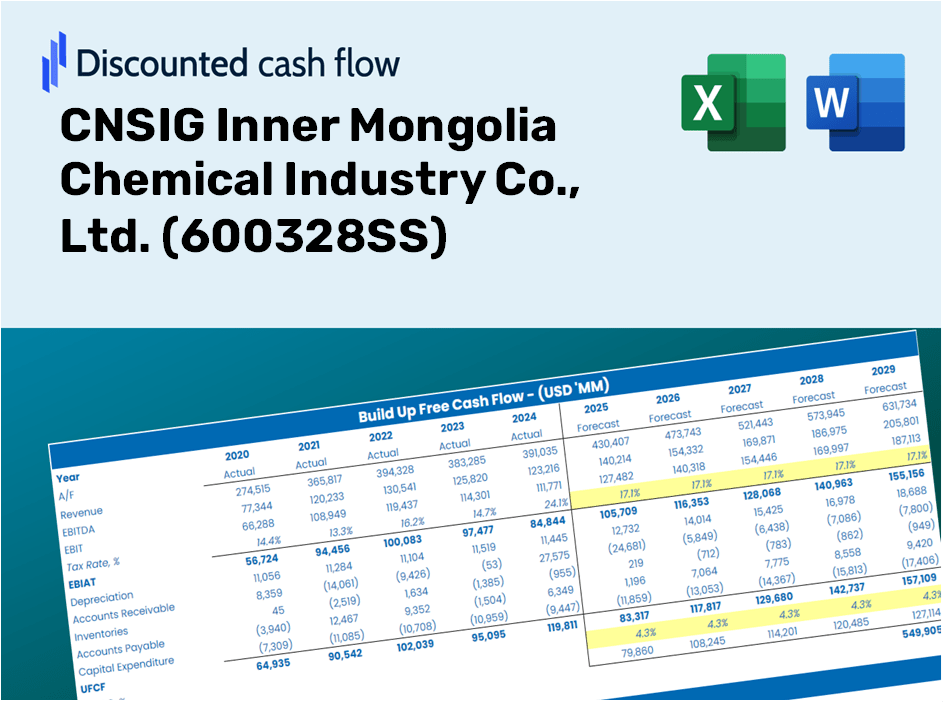
CNSIG Inner Mongolia Chemical Industry Co., Ltd. (600328.SS) Bundle
Ya sea que sea un inversor o un analista, esta calculadora DCF (600328SS) es su herramienta esencial para una valoración precisa. Cargados con datos reales de CNSIG Inner Mongolia Chemical Industry Co., Ltd., puede ajustar los pronósticos y observar los efectos en tiempo real.
Discounted Cash Flow (DCF) - (USD MM)
| Year | AY1 2020 |
AY2 2021 |
AY3 2022 |
AY4 2023 |
AY5 2024 |
FY1 2025 |
FY2 2026 |
FY3 2027 |
FY4 2028 |
FY5 2029 |
|---|---|---|---|---|---|---|---|---|---|---|
| Revenue | 9,752.6 | 13,413.4 | 18,162.5 | 16,255.8 | 12,892.5 | 12,621.5 | 12,356.2 | 12,096.5 | 11,842.2 | 11,593.3 |
| Revenue Growth, % | 0 | 37.54 | 35.41 | -10.5 | -20.69 | -2.1 | -2.1 | -2.1 | -2.1 | -2.1 |
| EBITDA | 1,697.4 | 3,156.7 | 4,335.7 | 3,281.8 | 2,077.4 | 2,552.4 | 2,498.7 | 2,446.2 | 2,394.8 | 2,344.5 |
| EBITDA, % | 17.4 | 23.53 | 23.87 | 20.19 | 16.11 | 20.22 | 20.22 | 20.22 | 20.22 | 20.22 |
| Depreciation | 776.7 | 881.9 | 1,025.4 | 1,065.6 | 1,103.6 | 891.1 | 872.3 | 854.0 | 836.0 | 818.5 |
| Depreciation, % | 7.96 | 6.57 | 5.65 | 6.56 | 8.56 | 7.06 | 7.06 | 7.06 | 7.06 | 7.06 |
| EBIT | 920.7 | 2,274.8 | 3,310.3 | 2,216.2 | 973.8 | 1,661.3 | 1,626.4 | 1,592.2 | 1,558.7 | 1,526.0 |
| EBIT, % | 9.44 | 16.96 | 18.23 | 13.63 | 7.55 | 13.16 | 13.16 | 13.16 | 13.16 | 13.16 |
| Total Cash | 588.7 | 898.7 | 2,603.7 | 1,753.9 | 1,124.1 | 1,175.8 | 1,151.1 | 1,126.9 | 1,103.2 | 1,080.0 |
| Total Cash, percent | .0 | .0 | .0 | .0 | .0 | .0 | .0 | .0 | .0 | .0 |
| Account Receivables | 1,215.5 | 1,063.3 | 3,017.9 | 2,082.2 | 2,153.5 | 1,679.1 | 1,643.8 | 1,609.3 | 1,575.5 | 1,542.3 |
| Account Receivables, % | 12.46 | 7.93 | 16.62 | 12.81 | 16.7 | 13.3 | 13.3 | 13.3 | 13.3 | 13.3 |
| Inventories | 689.8 | 1,486.4 | 1,318.8 | 942.1 | 903.1 | 964.7 | 944.4 | 924.6 | 905.1 | 886.1 |
| Inventories, % | 7.07 | 11.08 | 7.26 | 5.8 | 7.01 | 7.64 | 7.64 | 7.64 | 7.64 | 7.64 |
| Accounts Payable | 2,447.3 | 3,998.2 | 1,254.8 | 1,182.2 | 2,671.9 | 2,267.0 | 2,219.4 | 2,172.7 | 2,127.1 | 2,082.3 |
| Accounts Payable, % | 25.09 | 29.81 | 6.91 | 7.27 | 20.72 | 17.96 | 17.96 | 17.96 | 17.96 | 17.96 |
| Capital Expenditure | -54.6 | -23.7 | -41.4 | -63.0 | -626.2 | -156.7 | -153.4 | -150.2 | -147.1 | -144.0 |
| Capital Expenditure, % | -0.55969 | -0.17659 | -0.22814 | -0.38736 | -4.86 | -1.24 | -1.24 | -1.24 | -1.24 | -1.24 |
| Tax Rate, % | 43.11 | 43.11 | 43.11 | 43.11 | 43.11 | 43.11 | 43.11 | 43.11 | 43.11 | 43.11 |
| EBITAT | 685.6 | 1,577.1 | 1,956.3 | 1,185.9 | 554.0 | 1,040.9 | 1,019.1 | 997.6 | 976.7 | 956.1 |
| Depreciation | ||||||||||
| Changes in Account Receivables | ||||||||||
| Changes in Inventories | ||||||||||
| Changes in Accounts Payable | ||||||||||
| Capital Expenditure | ||||||||||
| UFCF | 1,949.8 | 3,341.8 | -1,590.3 | 3,428.3 | 2,488.8 | 1,783.2 | 1,745.9 | 1,709.2 | 1,673.3 | 1,638.1 |
| WACC, % | 7.41 | 7.38 | 7.32 | 7.29 | 7.31 | 7.34 | 7.34 | 7.34 | 7.34 | 7.34 |
| PV UFCF | ||||||||||
| SUM PV UFCF | 6,968.3 | |||||||||
| Long Term Growth Rate, % | 0.50 | |||||||||
| Free cash flow (T + 1) | 1,646 | |||||||||
| Terminal Value | 24,064 | |||||||||
| Present Terminal Value | 16,886 | |||||||||
| Enterprise Value | 23,855 | |||||||||
| Net Debt | -315 | |||||||||
| Equity Value | 24,170 | |||||||||
| Diluted Shares Outstanding, MM | 1,459 | |||||||||
| Equity Value Per Share | 16.56 |
Benefits You Will Receive
- Customizable Excel Template: A fully editable Excel-based DCF Calculator featuring real financial data for CNSIG Inner Mongolia Chemical Industry Co., Ltd. (600328SS).
- Accurate Historical Data: Access to past financial data and projections (highlighted in the yellow cells).
- Flexible Forecasting: Adjust key assumptions such as revenue growth, EBITDA margin, and WACC as needed.
- Instant Calculations: Quickly observe how your inputs affect the valuation of CNSIG Inner Mongolia Chemical Industry Co., Ltd. (600328SS).
- Professional-Grade Tool: Designed for the use of investors, CFOs, consultants, and financial analysts.
- User-Friendly Interface: Organized for ease of understanding and navigation, complete with clear step-by-step guidance.
Key Features of CNSIG Inner Mongolia Chemical Industry Co., Ltd. (600328SS)
- Customizable Forecast Inputs: Adjust essential variables such as revenue growth, EBITDA %, and capital expenditures to suit your analysis.
- Instant DCF Valuation: Quickly computes intrinsic value, NPV, and other related outputs for informed decision-making.
- High-Precision Accuracy: Leverages CNSIG's actual financial data for realistic and reliable valuation results.
- Streamlined Scenario Analysis: Easily test various assumptions and assess the impact on outcomes.
- Efficiency Booster: Avoid the hassle of constructing intricate valuation models from the ground up.
How It Functions
- Step 1: Download the Excel template.
- Step 2: Examine the pre-filled data for CNSIG Inner Mongolia Chemical Industry Co., Ltd. (600328SS) (historical and projected).
- Step 3: Modify key assumptions (highlighted in yellow) according to your findings.
- Step 4: Observe the automatic recalculations reflecting the intrinsic value of CNSIG Inner Mongolia Chemical Industry Co., Ltd. (600328SS).
- Step 5: Utilize the results for your investment strategies or reporting purposes.
Why Opt for This Calculator?
- Designed for Industry Experts: A sophisticated tool tailored for analysts, CFOs, and consultants.
- Accurate Data Integration: Historical and projected financial information for CNSIG Inner Mongolia Chemical Industry Co., Ltd. (600328SS) preloaded for precision.
- Versatile Scenario Analysis: Effortlessly simulate various forecasts and assumptions.
- Concise Results: Automatically computes intrinsic value, NPV, and essential financial metrics.
- User-Friendly Experience: Comprehensive, step-by-step instructions take you through the process seamlessly.
Who Should Utilize This Product?
- Individual Investors: Make informed decisions regarding the purchase or sale of CNSIG Inner Mongolia Chemical Industry Co., Ltd. (600328SS).
- Financial Analysts: Enhance valuation processes with readily available financial models tailored for CNSIG Inner Mongolia Chemical Industry Co., Ltd. (600328SS).
- Consultants: Provide clients with accurate and timely valuation insights for CNSIG Inner Mongolia Chemical Industry Co., Ltd. (600328SS).
- Business Owners: Learn from the valuation strategies of large companies like CNSIG Inner Mongolia Chemical Industry Co., Ltd. (600328SS) to refine your own business approach.
- Finance Students: Acquire practical valuation skills by analyzing data and scenarios related to CNSIG Inner Mongolia Chemical Industry Co., Ltd. (600328SS).
Overview of Template Features
- Pre-Filled DCF Model: Financial data for CNSIG Inner Mongolia Chemical Industry Co., Ltd. (600328SS) preloaded for immediate application.
- WACC Calculator: Comprehensive calculations for Weighted Average Cost of Capital.
- Financial Ratios: Assess CNSIG's profitability, leverage, and operational efficiency.
- Editable Inputs: Modify assumptions such as growth rates, margins, and capital expenditures to align with your analysis.
- Financial Statements: Access annual and quarterly reports for in-depth review.
- Interactive Dashboard: Effortlessly visualize essential valuation metrics and outcomes.
Disclaimer
All information, articles, and product details provided on this website are for general informational and educational purposes only. We do not claim any ownership over, nor do we intend to infringe upon, any trademarks, copyrights, logos, brand names, or other intellectual property mentioned or depicted on this site. Such intellectual property remains the property of its respective owners, and any references here are made solely for identification or informational purposes, without implying any affiliation, endorsement, or partnership.
We make no representations or warranties, express or implied, regarding the accuracy, completeness, or suitability of any content or products presented. Nothing on this website should be construed as legal, tax, investment, financial, medical, or other professional advice. In addition, no part of this site—including articles or product references—constitutes a solicitation, recommendation, endorsement, advertisement, or offer to buy or sell any securities, franchises, or other financial instruments, particularly in jurisdictions where such activity would be unlawful.
All content is of a general nature and may not address the specific circumstances of any individual or entity. It is not a substitute for professional advice or services. Any actions you take based on the information provided here are strictly at your own risk. You accept full responsibility for any decisions or outcomes arising from your use of this website and agree to release us from any liability in connection with your use of, or reliance upon, the content or products found herein.