
|
Sinomach Automobile Co., Ltd. (600335.ss) Valoración de DCF |
Completamente Editable: Adáptelo A Sus Necesidades En Excel O Sheets
Diseño Profesional: Plantillas Confiables Y Estándares De La Industria
Predeterminadas Para Un Uso Rápido Y Eficiente
Compatible con MAC / PC, completamente desbloqueado
No Se Necesita Experiencia; Fáciles De Seguir
Sinomach Automobile Co., Ltd. (600335.SS) Bundle
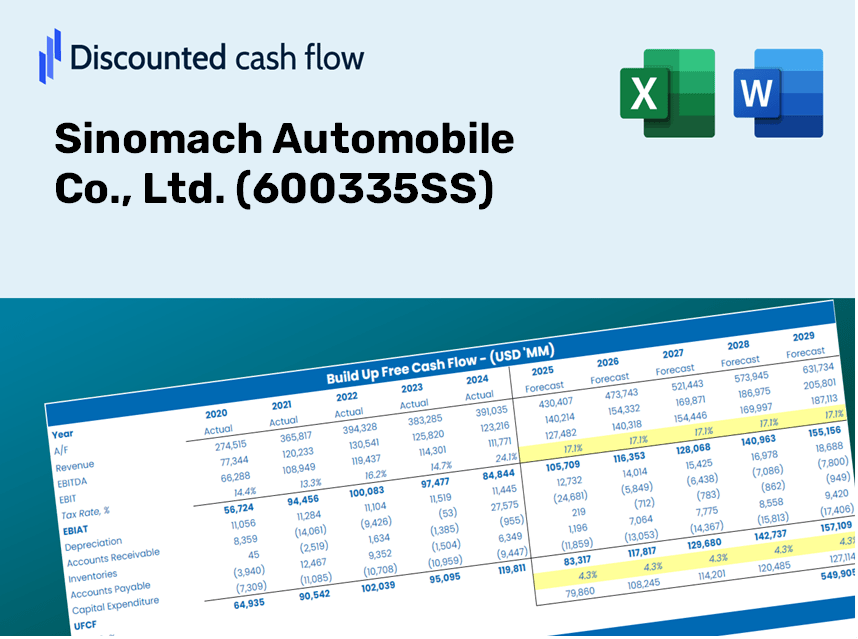
¡Simplifique Sinomach Automobile Co., Ltd. (600335SS) Valoración con esta calculadora DCF personalizable! Con Real Sinomach Automobile Co., Ltd. (600335SS) financieras y entradas de pronóstico ajustables, puede probar escenarios y descubrir Sinomach Automobile Co., Ltd. (600335SS) valor razonable en minutos.
Discounted Cash Flow (DCF) - (USD MM)
| Year | AY1 2020 |
AY2 2021 |
AY3 2022 |
AY4 2023 |
AY5 2024 |
FY1 2025 |
FY2 2026 |
FY3 2027 |
FY4 2028 |
FY5 2029 |
|---|---|---|---|---|---|---|---|---|---|---|
| Revenue | 44,134.8 | 43,945.3 | 39,569.1 | 43,519.8 | 42,024.7 | 41,621.4 | 41,222.0 | 40,826.4 | 40,434.6 | 40,046.5 |
| Revenue Growth, % | 0 | -0.4295 | -9.96 | 9.98 | -3.44 | -0.9597 | -0.9597 | -0.9597 | -0.9597 | -0.9597 |
| EBITDA | 1,959.5 | 1,116.8 | 882.2 | 626.2 | 1,067.6 | 1,098.0 | 1,087.4 | 1,077.0 | 1,066.7 | 1,056.4 |
| EBITDA, % | 4.44 | 2.54 | 2.23 | 1.44 | 2.54 | 2.64 | 2.64 | 2.64 | 2.64 | 2.64 |
| Depreciation | 467.3 | 457.7 | 438.2 | 523.0 | 571.8 | 480.3 | 475.7 | 471.2 | 466.6 | 462.2 |
| Depreciation, % | 1.06 | 1.04 | 1.11 | 1.2 | 1.36 | 1.15 | 1.15 | 1.15 | 1.15 | 1.15 |
| EBIT | 1,492.2 | 659.1 | 444.0 | 103.1 | 495.8 | 617.6 | 611.7 | 605.8 | 600.0 | 594.2 |
| EBIT, % | 3.38 | 1.5 | 1.12 | 0.23693 | 1.18 | 1.48 | 1.48 | 1.48 | 1.48 | 1.48 |
| Total Cash | 5,312.8 | 5,937.0 | 3,361.1 | 3,694.7 | 5,727.1 | 4,674.9 | 4,630.0 | 4,585.6 | 4,541.6 | 4,498.0 |
| Total Cash, percent | .0 | .0 | .0 | .0 | .0 | .0 | .0 | .0 | .0 | .0 |
| Account Receivables | 9,777.2 | 9,766.7 | 11,443.0 | 11,686.4 | 9,460.3 | 10,210.6 | 10,112.7 | 10,015.6 | 9,919.5 | 9,824.3 |
| Account Receivables, % | 22.15 | 22.22 | 28.92 | 26.85 | 22.51 | 24.53 | 24.53 | 24.53 | 24.53 | 24.53 |
| Inventories | 6,720.1 | 3,541.2 | 7,332.0 | 7,055.3 | 8,347.6 | 6,483.7 | 6,421.5 | 6,359.9 | 6,298.8 | 6,238.4 |
| Inventories, % | 15.23 | 8.06 | 18.53 | 16.21 | 19.86 | 15.58 | 15.58 | 15.58 | 15.58 | 15.58 |
| Accounts Payable | 9,849.0 | 5,255.8 | 9,511.1 | 13,143.4 | 10,891.3 | 9,525.4 | 9,434.0 | 9,343.5 | 9,253.8 | 9,165.0 |
| Accounts Payable, % | 22.32 | 11.96 | 24.04 | 30.2 | 25.92 | 22.89 | 22.89 | 22.89 | 22.89 | 22.89 |
| Capital Expenditure | -522.2 | -639.6 | -638.9 | -1,241.4 | -1,151.2 | -819.5 | -811.7 | -803.9 | -796.2 | -788.5 |
| Capital Expenditure, % | -1.18 | -1.46 | -1.61 | -2.85 | -2.74 | -1.97 | -1.97 | -1.97 | -1.97 | -1.97 |
| Tax Rate, % | 25.86 | 25.86 | 25.86 | 25.86 | 25.86 | 25.86 | 25.86 | 25.86 | 25.86 | 25.86 |
| EBITAT | 1,278.8 | 394.1 | 291.3 | 14.1 | 367.6 | 369.2 | 365.6 | 362.1 | 358.7 | 355.2 |
| Depreciation | ||||||||||
| Changes in Account Receivables | ||||||||||
| Changes in Inventories | ||||||||||
| Changes in Accounts Payable | ||||||||||
| Capital Expenditure | ||||||||||
| UFCF | -5,424.5 | -1,191.5 | -1,121.2 | 2,961.2 | -1,530.0 | -222.4 | 98.5 | 97.5 | 96.6 | 95.7 |
| WACC, % | 5.91 | 5.55 | 5.63 | 4.92 | 5.75 | 5.55 | 5.55 | 5.55 | 5.55 | 5.55 |
| PV UFCF | ||||||||||
| SUM PV UFCF | 111.5 | |||||||||
| Long Term Growth Rate, % | 2.00 | |||||||||
| Free cash flow (T + 1) | 98 | |||||||||
| Terminal Value | 2,747 | |||||||||
| Present Terminal Value | 2,097 | |||||||||
| Enterprise Value | 2,208 | |||||||||
| Net Debt | -2,578 | |||||||||
| Equity Value | 4,787 | |||||||||
| Diluted Shares Outstanding, MM | 1,496 | |||||||||
| Equity Value Per Share | 3.20 |
What You Will Receive
- Customizable Excel Template: An adaptable Excel-based DCF Calculator featuring pre-filled financial data for Sinomach Automobile Co., Ltd. (600335SS).
- Accurate Data Insights: Access to historical performance data and future projections (highlighted in the yellow cells).
- Flexible Forecasting: Adjust key assumptions such as revenue growth, EBITDA percentage, and WACC.
- Instant Calculations: Quickly observe how your inputs affect the valuation of Sinomach Automobile Co., Ltd. (600335SS).
- Professional-Grade Tool: Designed for investors, CFOs, consultants, and financial analysts.
- User-Centric Design: Organized for simplicity and ease of navigation, complete with step-by-step guidance.
Key Features
- Authentic Sinomach Financials: Obtain reliable historical data and forecasts specifically for Sinomach Automobile Co., Ltd. (600335SS).
- Adjustable Forecast Parameters: Modify highlighted cells to personalize WACC, growth rates, and profit margins.
- Real-Time Calculations: Enjoy automatic updates on DCF, Net Present Value (NPV), and cash flow analysis.
- User-Friendly Dashboard: Access easily interpretable charts and summaries for a clear overview of your valuation insights.
- Designed for All Levels: A straightforward and intuitive layout tailored for investors, CFOs, and consultants alike.
How It Functions
- Download: Obtain the pre-configured Excel file containing Sinomach Automobile Co., Ltd.'s (600335SS) financial data.
- Customize: Modify forecasts, such as revenue growth, EBITDA percentage, and WACC.
- Update Automatically: The calculations for intrinsic value and NPV refresh in real-time.
- Test Scenarios: Develop various projections and instantly compare the results.
- Make Decisions: Leverage the valuation findings to inform your investment strategy.
Reasons to Choose Sinomach Automobile Co., Ltd. (600335SS)
- Precision: Leverage genuine Sinomach financial data for reliable insights.
- Adaptability: Tailored for users to easily experiment and adjust variables as needed.
- Efficiency: Bypass the complexities of creating models from the ground up.
- High-Quality: Engineered with the standards expected at the CFO level for accuracy and ease of use.
- Intuitive Interface: Simple to navigate, even for those new to financial modeling.
Who Should Consider This Product?
- Individual Investors: Gain valuable insights for informed decisions on buying or selling shares of Sinomach Automobile Co., Ltd. (600335SS).
- Financial Analysts: Enhance your valuation assessments with comprehensive financial models tailored for Sinomach Automobile Co., Ltd. (600335SS).
- Consultants: Provide clients with accurate and timely valuation analysis related to Sinomach Automobile Co., Ltd. (600335SS).
- Business Owners: Learn how significant companies like Sinomach Automobile Co., Ltd. (600335SS) are valued to inform your own business strategies.
- Finance Students: Acquire practical knowledge of valuation techniques through real-world data and case studies involving Sinomach Automobile Co., Ltd. (600335SS).
What the Template Includes
- Pre-Filled DCF Model: Sinomach Automobile's financial data preloaded for immediate application.
- WACC Calculator: Comprehensive calculations for Weighted Average Cost of Capital.
- Financial Ratios: Assess Sinomach Automobile's profitability, leverage, and operational efficiency.
- Editable Inputs: Modify assumptions such as growth rates, margins, and CAPEX to match your scenarios.
- Financial Statements: Annual and quarterly reports available for thorough analysis.
- Interactive Dashboard: Effortlessly visualize key valuation metrics and outcomes.
Disclaimer
All information, articles, and product details provided on this website are for general informational and educational purposes only. We do not claim any ownership over, nor do we intend to infringe upon, any trademarks, copyrights, logos, brand names, or other intellectual property mentioned or depicted on this site. Such intellectual property remains the property of its respective owners, and any references here are made solely for identification or informational purposes, without implying any affiliation, endorsement, or partnership.
We make no representations or warranties, express or implied, regarding the accuracy, completeness, or suitability of any content or products presented. Nothing on this website should be construed as legal, tax, investment, financial, medical, or other professional advice. In addition, no part of this site—including articles or product references—constitutes a solicitation, recommendation, endorsement, advertisement, or offer to buy or sell any securities, franchises, or other financial instruments, particularly in jurisdictions where such activity would be unlawful.
All content is of a general nature and may not address the specific circumstances of any individual or entity. It is not a substitute for professional advice or services. Any actions you take based on the information provided here are strictly at your own risk. You accept full responsibility for any decisions or outcomes arising from your use of this website and agree to release us from any liability in connection with your use of, or reliance upon, the content or products found herein.