
|
Aucma Co., Ltd. (600336.ss) Valoración de DCF |
Completamente Editable: Adáptelo A Sus Necesidades En Excel O Sheets
Diseño Profesional: Plantillas Confiables Y Estándares De La Industria
Predeterminadas Para Un Uso Rápido Y Eficiente
Compatible con MAC / PC, completamente desbloqueado
No Se Necesita Experiencia; Fáciles De Seguir
AUCMA Co.,Ltd. (600336.SS) Bundle
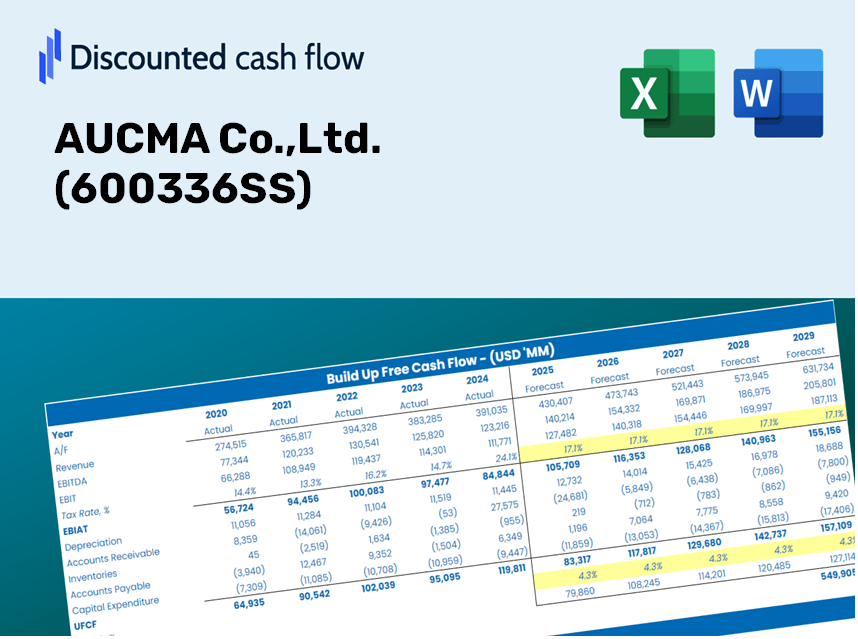
Ya sea que sea un inversor o analista, esta calculadora DCF (600336SS) es su herramienta final para una valoración precisa. Prelabastado con datos reales de Aucma Co., Ltd., puede ajustar los pronósticos y observar los efectos al instante.
Discounted Cash Flow (DCF) - (USD MM)
| Year | AY1 2020 |
AY2 2021 |
AY3 2022 |
AY4 2023 |
AY5 2024 |
FY1 2025 |
FY2 2026 |
FY3 2027 |
FY4 2028 |
FY5 2029 |
|---|---|---|---|---|---|---|---|---|---|---|
| Revenue | 7,059.2 | 8,625.7 | 9,566.8 | 9,303.8 | 7,816.1 | 8,096.7 | 8,387.4 | 8,688.5 | 9,000.4 | 9,323.6 |
| Revenue Growth, % | 0 | 22.19 | 10.91 | -2.75 | -15.99 | 3.59 | 3.59 | 3.59 | 3.59 | 3.59 |
| EBITDA | 778.4 | 488.5 | 367.8 | 211.1 | 154.9 | 401.4 | 415.8 | 430.7 | 446.2 | 462.2 |
| EBITDA, % | 11.03 | 5.66 | 3.84 | 2.27 | 1.98 | 4.96 | 4.96 | 4.96 | 4.96 | 4.96 |
| Depreciation | 115.6 | 141.2 | 138.1 | 134.7 | 138.1 | 128.5 | 133.1 | 137.9 | 142.8 | 147.9 |
| Depreciation, % | 1.64 | 1.64 | 1.44 | 1.45 | 1.77 | 1.59 | 1.59 | 1.59 | 1.59 | 1.59 |
| EBIT | 662.8 | 347.3 | 229.6 | 76.4 | 16.8 | 272.9 | 282.7 | 292.8 | 303.4 | 314.3 |
| EBIT, % | 9.39 | 4.03 | 2.4 | 0.82152 | 0.21507 | 3.37 | 3.37 | 3.37 | 3.37 | 3.37 |
| Total Cash | 1,031.6 | 1,209.4 | 816.8 | 635.1 | 914.0 | 901.9 | 934.2 | 967.8 | 1,002.5 | 1,038.5 |
| Total Cash, percent | .0 | .0 | .0 | .0 | .0 | .0 | .0 | .0 | .0 | .0 |
| Account Receivables | 2,666.3 | 2,020.4 | 1,986.8 | 2,793.1 | 2,135.9 | 2,255.9 | 2,336.9 | 2,420.8 | 2,507.7 | 2,597.8 |
| Account Receivables, % | 37.77 | 23.42 | 20.77 | 30.02 | 27.33 | 27.86 | 27.86 | 27.86 | 27.86 | 27.86 |
| Inventories | 1,508.9 | 1,343.9 | 1,200.5 | 1,311.1 | 1,540.5 | 1,349.0 | 1,397.4 | 1,447.6 | 1,499.6 | 1,553.4 |
| Inventories, % | 21.38 | 15.58 | 12.55 | 14.09 | 19.71 | 16.66 | 16.66 | 16.66 | 16.66 | 16.66 |
| Accounts Payable | 2,912.0 | 2,643.7 | 1,998.1 | 2,960.3 | 2,957.6 | 2,630.5 | 2,724.9 | 2,822.8 | 2,924.1 | 3,029.1 |
| Accounts Payable, % | 41.25 | 30.65 | 20.89 | 31.82 | 37.84 | 32.49 | 32.49 | 32.49 | 32.49 | 32.49 |
| Capital Expenditure | -392.6 | -305.3 | -282.1 | -288.3 | -190.5 | -284.8 | -295.0 | -305.6 | -316.6 | -327.9 |
| Capital Expenditure, % | -5.56 | -3.54 | -2.95 | -3.1 | -2.44 | -3.52 | -3.52 | -3.52 | -3.52 | -3.52 |
| Tax Rate, % | -24.58 | -24.58 | -24.58 | -24.58 | -24.58 | -24.58 | -24.58 | -24.58 | -24.58 | -24.58 |
| EBITAT | 510.7 | 241.4 | 197.0 | 136.9 | 20.9 | 236.0 | 244.4 | 253.2 | 262.3 | 271.7 |
| Depreciation | ||||||||||
| Changes in Account Receivables | ||||||||||
| Changes in Inventories | ||||||||||
| Changes in Accounts Payable | ||||||||||
| Capital Expenditure | ||||||||||
| UFCF | -1,029.6 | 620.0 | -415.6 | 28.6 | 393.6 | -175.9 | 47.5 | 49.2 | 51.0 | 52.8 |
| WACC, % | 5.74 | 5.67 | 5.82 | 5.94 | 5.94 | 5.82 | 5.82 | 5.82 | 5.82 | 5.82 |
| PV UFCF | ||||||||||
| SUM PV UFCF | -1.7 | |||||||||
| Long Term Growth Rate, % | 2.00 | |||||||||
| Free cash flow (T + 1) | 54 | |||||||||
| Terminal Value | 1,410 | |||||||||
| Present Terminal Value | 1,063 | |||||||||
| Enterprise Value | 1,061 | |||||||||
| Net Debt | 314 | |||||||||
| Equity Value | 747 | |||||||||
| Diluted Shares Outstanding, MM | 809 | |||||||||
| Equity Value Per Share | 0.92 |
Benefits You Will Receive
- Accurate AUCMA Financials: Access to both historical and projected data for precise valuation.
- Customizable Inputs: Adjust WACC, tax rates, revenue growth, and capital expenditures as needed.
- Instant Calculations: Intrinsic value and NPV are computed in real time.
- Scenario Testing: Explore various scenarios to assess AUCMA's future growth.
- User-Friendly Design: Tailored for professionals while remaining easy to navigate for newcomers.
Key Features
- 🔍 Real-Life AUCMA Financials: Pre-filled historical and projected data for AUCMA Co., Ltd. (600336SS).
- ✏️ Fully Customizable Inputs: Adjust all critical parameters (yellow cells) such as WACC, growth %, and tax rates.
- 📊 Professional DCF Valuation: Integrated formulas calculate AUCMA's intrinsic value using the Discounted Cash Flow method.
- ⚡ Instant Results: Visualize AUCMA's valuation immediately after making adjustments.
- Scenario Analysis: Analyze and compare outcomes for different financial assumptions side-by-side.
How It Works
- Download the Template: Gain immediate access to the Excel-based AUCMA Co., Ltd. DCF Calculator.
- Input Your Assumptions: Modify the yellow-highlighted cells for growth rates, WACC, margins, and more.
- Instant Calculations: The model updates AUCMA Co., Ltd.'s intrinsic value automatically.
- Test Scenarios: Experiment with various assumptions to assess potential valuation fluctuations.
- Analyze and Decide: Utilize the results to inform your investment or financial analysis.
Why Choose AUCMA Co., Ltd. Calculator?
- User-Friendly Design: Perfect for both novices and seasoned users.
- Customizable Inputs: Easily adjust variables to suit your financial analysis.
- Real-Time Updates: Observe immediate changes to AUCMA’s valuation as you modify inputs.
- Preloaded Data: Comes with AUCMA's actual financial information for swift evaluations.
- Preferred by Experts: Valued by investors and analysts for making well-informed choices.
Who Can Benefit from AUCMA Co., Ltd.?
- Retail Investors: Gain insights to make informed investment decisions regarding AUCMA Co., Ltd. (600336SS).
- Equity Analysts: Enhance your valuation techniques with comprehensive financial models specific to AUCMA Co., Ltd. (600336SS).
- Consultants: Provide accurate and timely valuation assessments of AUCMA Co., Ltd. (600336SS) for your clients.
- Entrepreneurs: Learn from the valuation of established companies like AUCMA Co., Ltd. (600336SS) to refine your own business strategies.
- Finance Students: Explore practical valuation methodologies utilizing data and case studies related to AUCMA Co., Ltd. (600336SS).
What the Template Includes
- Pre-Filled DCF Model: AUCMA Co.,Ltd.'s financial data preloaded for immediate analysis.
- WACC Calculator: Comprehensive calculations for Weighted Average Cost of Capital.
- Financial Ratios: Assess AUCMA Co.,Ltd.'s profitability, leverage, and operational efficiency.
- Editable Inputs: Adjust variables such as growth rates, profit margins, and CAPEX to tailor your scenarios.
- Financial Statements: Access annual and quarterly reports for in-depth examination.
- Interactive Dashboard: Effortlessly visualize essential valuation metrics and outcomes.
Disclaimer
All information, articles, and product details provided on this website are for general informational and educational purposes only. We do not claim any ownership over, nor do we intend to infringe upon, any trademarks, copyrights, logos, brand names, or other intellectual property mentioned or depicted on this site. Such intellectual property remains the property of its respective owners, and any references here are made solely for identification or informational purposes, without implying any affiliation, endorsement, or partnership.
We make no representations or warranties, express or implied, regarding the accuracy, completeness, or suitability of any content or products presented. Nothing on this website should be construed as legal, tax, investment, financial, medical, or other professional advice. In addition, no part of this site—including articles or product references—constitutes a solicitation, recommendation, endorsement, advertisement, or offer to buy or sell any securities, franchises, or other financial instruments, particularly in jurisdictions where such activity would be unlawful.
All content is of a general nature and may not address the specific circumstances of any individual or entity. It is not a substitute for professional advice or services. Any actions you take based on the information provided here are strictly at your own risk. You accept full responsibility for any decisions or outcomes arising from your use of this website and agree to release us from any liability in connection with your use of, or reliance upon, the content or products found herein.