
|
China Fortune Land Development Co., Ltd. (600340.SS) Valoración de DCF |
Completamente Editable: Adáptelo A Sus Necesidades En Excel O Sheets
Diseño Profesional: Plantillas Confiables Y Estándares De La Industria
Predeterminadas Para Un Uso Rápido Y Eficiente
Compatible con MAC / PC, completamente desbloqueado
No Se Necesita Experiencia; Fáciles De Seguir
China Fortune Land Development Co., Ltd. (600340.SS) Bundle
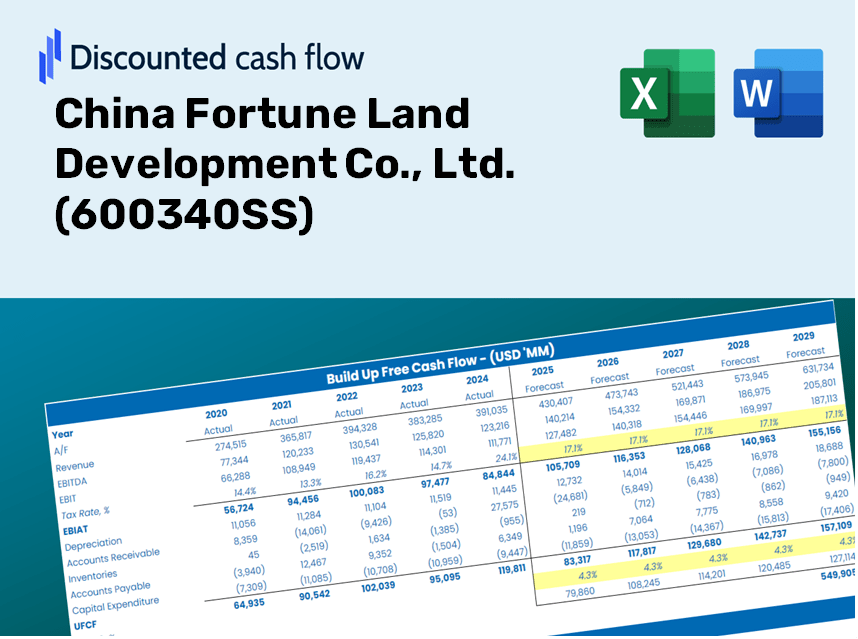
¡Evalúe la perspectiva financiera de China Fortune Land Development Co., Ltd. como un experto! Esta calculadora DCF (600340SS) ofrece datos financieros previamente llenos y le proporciona la flexibilidad para modificar el crecimiento de los ingresos, WACC, los márgenes de ganancias y otros supuestos críticos para alinearse con sus proyecciones.
Discounted Cash Flow (DCF) - (USD MM)
| Year | AY1 2020 |
AY2 2021 |
AY3 2022 |
AY4 2023 |
AY5 2024 |
FY1 2025 |
FY2 2026 |
FY3 2027 |
FY4 2028 |
FY5 2029 |
|---|---|---|---|---|---|---|---|---|---|---|
| Revenue | 101,208.5 | 43,180.8 | 31,941.7 | 35,906.6 | 23,765.5 | 31,028.2 | 40,510.3 | 52,890.2 | 69,053.4 | 90,156.0 |
| Revenue Growth, % | 0 | -57.33 | -26.03 | 12.41 | -33.81 | 30.56 | 30.56 | 30.56 | 30.56 | 30.56 |
| EBITDA | 16,775.9 | -25,748.8 | 18,296.3 | 928.6 | 1,746.3 | 1,499.3 | 1,957.4 | 2,555.6 | 3,336.6 | 4,356.3 |
| EBITDA, % | 16.58 | -59.63 | 57.28 | 2.59 | 7.35 | 4.83 | 4.83 | 4.83 | 4.83 | 4.83 |
| Depreciation | 1,414.7 | 1,665.9 | 1,180.3 | 767.7 | 676.1 | 864.7 | 1,128.9 | 1,473.9 | 1,924.4 | 2,512.4 |
| Depreciation, % | 1.4 | 3.86 | 3.7 | 2.14 | 2.84 | 2.79 | 2.79 | 2.79 | 2.79 | 2.79 |
| EBIT | 15,361.1 | -27,414.7 | 17,116.0 | 160.9 | 1,070.2 | 634.6 | 828.5 | 1,081.7 | 1,412.3 | 1,843.8 |
| EBIT, % | 15.18 | -63.49 | 53.58 | 0.44807 | 4.5 | 2.05 | 2.05 | 2.05 | 2.05 | 2.05 |
| Total Cash | 26,993.2 | 14,437.5 | 12,417.6 | 6,477.7 | 5,806.8 | 8,778.2 | 11,460.8 | 14,963.2 | 19,536.0 | 25,506.1 |
| Total Cash, percent | .0 | .0 | .0 | .0 | .0 | .0 | .0 | .0 | .0 | .0 |
| Account Receivables | 215,529.0 | 214,635.6 | 210,896.9 | 180,453.8 | 169,742.7 | 31,028.2 | 40,510.3 | 52,890.2 | 69,053.4 | 90,156.0 |
| Account Receivables, % | 212.96 | 497.06 | 660.26 | 502.56 | 714.24 | 100 | 100 | 100 | 100 | 100 |
| Inventories | 179,224.6 | 145,280.1 | 122,871.9 | 82,636.2 | 74,736.2 | 31,028.2 | 40,510.3 | 52,890.2 | 69,053.4 | 90,156.0 |
| Inventories, % | 177.08 | 336.45 | 384.68 | 230.14 | 314.47 | 100 | 100 | 100 | 100 | 100 |
| Accounts Payable | 57,541.0 | 57,706.8 | 50,987.5 | 43,382.3 | 37,197.2 | 28,350.7 | 37,014.6 | 48,326.2 | 63,094.6 | 82,376.2 |
| Accounts Payable, % | 56.85 | 133.64 | 159.63 | 120.82 | 156.52 | 91.37 | 91.37 | 91.37 | 91.37 | 91.37 |
| Capital Expenditure | -4,776.9 | -1,164.1 | -716.5 | -42.6 | -41.2 | -617.5 | -806.2 | -1,052.6 | -1,374.3 | -1,794.3 |
| Capital Expenditure, % | -4.72 | -2.7 | -2.24 | -0.11873 | -0.17327 | -1.99 | -1.99 | -1.99 | -1.99 | -1.99 |
| Tax Rate, % | 35.18 | 35.18 | 35.18 | 35.18 | 35.18 | 35.18 | 35.18 | 35.18 | 35.18 | 35.18 |
| EBITAT | 6,993.8 | -23,991.3 | 4,821.6 | 107.7 | 693.7 | 371.8 | 485.4 | 633.8 | 827.5 | 1,080.3 |
| Depreciation | ||||||||||
| Changes in Account Receivables | ||||||||||
| Changes in Inventories | ||||||||||
| Changes in Accounts Payable | ||||||||||
| Capital Expenditure | ||||||||||
| UFCF | -333,580.9 | 11,514.2 | 24,712.9 | 63,906.4 | 13,754.7 | 174,194.9 | -9,492.2 | -12,393.1 | -16,180.4 | -21,125.1 |
| WACC, % | 3.14 | 5.62 | 2.11 | 4.4 | 4.28 | 3.91 | 3.91 | 3.91 | 3.91 | 3.91 |
| PV UFCF | ||||||||||
| SUM PV UFCF | 116,484.9 | |||||||||
| Long Term Growth Rate, % | 0.50 | |||||||||
| Free cash flow (T + 1) | -21,231 | |||||||||
| Terminal Value | -622,818 | |||||||||
| Present Terminal Value | -514,161 | |||||||||
| Enterprise Value | -397,676 | |||||||||
| Net Debt | 129,754 | |||||||||
| Equity Value | -527,430 | |||||||||
| Diluted Shares Outstanding, MM | 3,885 | |||||||||
| Equity Value Per Share | -135.76 |
What You Will Receive
- Authentic China Fortune Data: Preloaded financials – encompassing revenue to EBIT – derived from actual and projected figures.
- Comprehensive Customization: Modify all essential parameters (yellow cells) such as WACC, growth %, and tax rates.
- Immediate Valuation Adjustments: Automatic recalculations to assess how changes impact the fair value of China Fortune Land Development Co., Ltd. (600340SS).
- Flexible Excel Template: Designed for easy modifications, scenario analysis, and detailed forecasts.
- Efficient and Precise: Avoid starting from scratch on model creation, while ensuring accuracy and adaptability.
Key Features
- Real-Life CFLD Data: Pre-filled with China Fortune Land Development Co., Ltd.’s historical financials and future projections.
- Fully Customizable Inputs: Modify revenue growth, profit margins, WACC, tax rates, and capital expenditures as per your requirements.
- Dynamic Valuation Model: Instant updates to Net Present Value (NPV) and intrinsic value based on your provided inputs.
- Scenario Testing: Develop multiple forecasting scenarios to explore various valuation results.
- User-Friendly Design: Intuitive, organized, and crafted for both professionals and novices.
How It Operates
- Download: Obtain the pre-prepared Excel file featuring China Fortune Land Development Co., Ltd.'s (600340SS) financial data.
- Customize: Modify projections, such as revenue growth, EBITDA percentage, and WACC.
- Update Automatically: The intrinsic value and NPV calculations refresh in real-time.
- Test Scenarios: Generate various forecasts and instantly compare results.
- Make Decisions: Leverage the valuation findings to inform your investment strategy.
Why Select This Calculator for China Fortune Land Development Co., Ltd. (600340SS)?
- Precision: Utilizes real financial data from China Fortune Land Development for greater accuracy.
- Versatility: Built for users to experiment with and adjust inputs seamlessly.
- Efficiency: Eliminate the need to create a DCF model from the ground up.
- Expert-Quality: Crafted with the expertise and usability typically found at the CFO level.
- Intuitive Design: Simple to navigate, even for those without extensive financial modeling knowledge.
Who Should Use This Product?
- Individual Investors: Gain insights to make informed decisions regarding investments in China Fortune Land Development Co., Ltd. (600340SS).
- Financial Analysts: Enhance valuation analyses with user-friendly financial models tailored for China Fortune Land Development Co., Ltd. (600340SS).
- Consultants: Provide clients with precise and timely valuation insights related to China Fortune Land Development Co., Ltd. (600340SS).
- Business Owners: Learn how major corporations like China Fortune Land Development Co., Ltd. (600340SS) are evaluated to inform your own business strategies.
- Finance Students: Master valuation methods using actual data and case studies from China Fortune Land Development Co., Ltd. (600340SS).
Contents of the Template
- Preloaded CFLD Data: Historical and projected financial figures, including revenue, EBIT, and capital expenditures.
- DCF and WACC Models: Expert-level spreadsheets for determining intrinsic value and Weighted Average Cost of Capital.
- Editable Inputs: Yellow-highlighted fields for modifying revenue growth, tax rates, and discount rates.
- Financial Statements: Detailed annual and quarterly financial statements for in-depth analysis.
- Key Ratios: Ratios for profitability, leverage, and efficiency to assess performance.
- Dashboard and Charts: Visual representations of valuation results and underlying assumptions.
Disclaimer
All information, articles, and product details provided on this website are for general informational and educational purposes only. We do not claim any ownership over, nor do we intend to infringe upon, any trademarks, copyrights, logos, brand names, or other intellectual property mentioned or depicted on this site. Such intellectual property remains the property of its respective owners, and any references here are made solely for identification or informational purposes, without implying any affiliation, endorsement, or partnership.
We make no representations or warranties, express or implied, regarding the accuracy, completeness, or suitability of any content or products presented. Nothing on this website should be construed as legal, tax, investment, financial, medical, or other professional advice. In addition, no part of this site—including articles or product references—constitutes a solicitation, recommendation, endorsement, advertisement, or offer to buy or sell any securities, franchises, or other financial instruments, particularly in jurisdictions where such activity would be unlawful.
All content is of a general nature and may not address the specific circumstances of any individual or entity. It is not a substitute for professional advice or services. Any actions you take based on the information provided here are strictly at your own risk. You accept full responsibility for any decisions or outcomes arising from your use of this website and agree to release us from any liability in connection with your use of, or reliance upon, the content or products found herein.