
|
Sino-Platinum Metals Co., Ltd (600459.ss) Valoración de DCF |
Completamente Editable: Adáptelo A Sus Necesidades En Excel O Sheets
Diseño Profesional: Plantillas Confiables Y Estándares De La Industria
Predeterminadas Para Un Uso Rápido Y Eficiente
Compatible con MAC / PC, completamente desbloqueado
No Se Necesita Experiencia; Fáciles De Seguir
Sino-Platinum Metals Co.,Ltd (600459.SS) Bundle
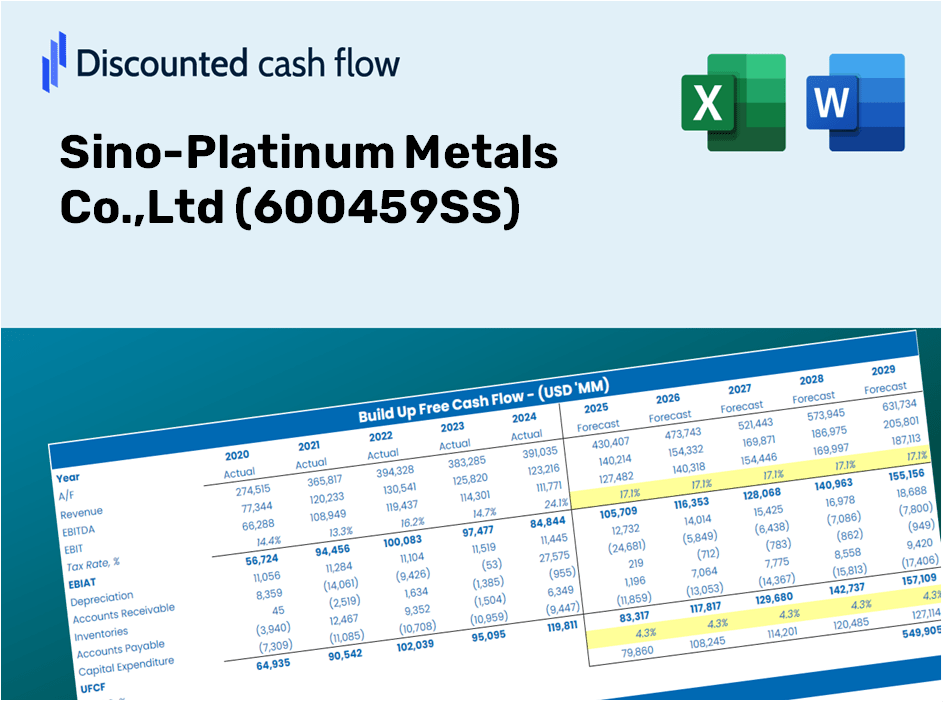
¡Obtenga información sobre su análisis de valoración Sino-Platinum Metals Co., LTD (600459SS) utilizando nuestra calculadora DCF de última generación! Esta plantilla de Excel viene previamente con datos reales (600459SS), lo que le permite ajustar preventos y supuestos para un cálculo preciso del valor intrínseco de sinoplatino.
Discounted Cash Flow (DCF) - (USD MM)
| Year | AY1 2020 |
AY2 2021 |
AY3 2022 |
AY4 2023 |
AY5 2024 |
FY1 2025 |
FY2 2026 |
FY3 2027 |
FY4 2028 |
FY5 2029 |
|---|---|---|---|---|---|---|---|---|---|---|
| Revenue | 28,926.5 | 36,350.9 | 40,758.7 | 45,085.6 | 47,503.6 | 53,889.4 | 61,133.7 | 69,351.8 | 78,674.6 | 89,250.7 |
| Revenue Growth, % | 0 | 25.67 | 12.13 | 10.62 | 5.36 | 13.44 | 13.44 | 13.44 | 13.44 | 13.44 |
| EBITDA | 612.8 | 719.1 | 826.7 | 850.8 | 958.4 | 1,081.0 | 1,226.3 | 1,391.2 | 1,578.2 | 1,790.4 |
| EBITDA, % | 2.12 | 1.98 | 2.03 | 1.89 | 2.02 | 2.01 | 2.01 | 2.01 | 2.01 | 2.01 |
| Depreciation | 79.4 | 104.3 | 105.9 | 126.5 | 151.2 | 153.1 | 173.6 | 197.0 | 223.5 | 253.5 |
| Depreciation, % | 0.27451 | 0.28696 | 0.25993 | 0.28051 | 0.31829 | 0.28404 | 0.28404 | 0.28404 | 0.28404 | 0.28404 |
| EBIT | 533.4 | 614.8 | 720.8 | 724.3 | 807.2 | 927.9 | 1,052.7 | 1,194.2 | 1,354.7 | 1,536.8 |
| EBIT, % | 1.84 | 1.69 | 1.77 | 1.61 | 1.7 | 1.72 | 1.72 | 1.72 | 1.72 | 1.72 |
| Total Cash | 1,516.6 | 2,071.1 | 3,188.1 | 1,780.5 | 2,887.5 | 3,102.9 | 3,520.1 | 3,993.3 | 4,530.1 | 5,139.0 |
| Total Cash, percent | .0 | .0 | .0 | .0 | .0 | .0 | .0 | .0 | .0 | .0 |
| Account Receivables | 2,534.4 | 3,674.0 | 3,273.7 | 2,883.6 | 4,548.3 | 4,620.6 | 5,241.8 | 5,946.4 | 6,745.8 | 7,652.6 |
| Account Receivables, % | 8.76 | 10.11 | 8.03 | 6.4 | 9.57 | 8.57 | 8.57 | 8.57 | 8.57 | 8.57 |
| Inventories | 3,954.2 | 3,460.7 | 3,905.3 | 4,231.0 | 4,330.4 | 5,526.0 | 6,268.9 | 7,111.6 | 8,067.6 | 9,152.1 |
| Inventories, % | 13.67 | 9.52 | 9.58 | 9.38 | 9.12 | 10.25 | 10.25 | 10.25 | 10.25 | 10.25 |
| Accounts Payable | 324.7 | 349.2 | 489.6 | 347.7 | 1,437.3 | 763.2 | 865.8 | 982.2 | 1,114.2 | 1,264.0 |
| Accounts Payable, % | 1.12 | 0.96075 | 1.2 | 0.77131 | 3.03 | 1.42 | 1.42 | 1.42 | 1.42 | 1.42 |
| Capital Expenditure | -220.0 | -127.9 | -190.0 | -202.3 | -354.3 | -298.9 | -339.1 | -384.7 | -436.4 | -495.0 |
| Capital Expenditure, % | -0.76059 | -0.35182 | -0.46618 | -0.44881 | -0.74591 | -0.55466 | -0.55466 | -0.55466 | -0.55466 | -0.55466 |
| Tax Rate, % | 18.91 | 18.91 | 18.91 | 18.91 | 18.91 | 18.91 | 18.91 | 18.91 | 18.91 | 18.91 |
| EBITAT | 421.3 | 411.1 | 557.0 | 558.4 | 654.6 | 707.6 | 802.8 | 910.7 | 1,033.1 | 1,172.0 |
| Depreciation | ||||||||||
| Changes in Account Receivables | ||||||||||
| Changes in Inventories | ||||||||||
| Changes in Accounts Payable | ||||||||||
| Capital Expenditure | ||||||||||
| UFCF | -5,883.4 | -234.0 | 569.0 | 405.1 | -223.1 | -1,380.2 | -624.1 | -708.0 | -803.1 | -911.1 |
| WACC, % | 6.46 | 6.36 | 6.45 | 6.45 | 6.48 | 6.44 | 6.44 | 6.44 | 6.44 | 6.44 |
| PV UFCF | ||||||||||
| SUM PV UFCF | -3,727.3 | |||||||||
| Long Term Growth Rate, % | 2.00 | |||||||||
| Free cash flow (T + 1) | -929 | |||||||||
| Terminal Value | -20,937 | |||||||||
| Present Terminal Value | -15,325 | |||||||||
| Enterprise Value | -19,053 | |||||||||
| Net Debt | -83 | |||||||||
| Equity Value | -18,969 | |||||||||
| Diluted Shares Outstanding, MM | 753 | |||||||||
| Equity Value Per Share | -25.21 |
What You Will Receive
- Genuine SP Metal Financials: Access historical and projected data for precise valuation.
- Customizable Inputs: Adjust WACC, tax rates, revenue growth, and capital expenditures as needed.
- Automated Calculations: Dynamic computation of intrinsic value and NPV.
- Scenario Analysis: Explore various scenarios to assess Sino-Platinum's future performance.
- Clear and User-Friendly Design: Tailored for industry professionals while remaining accessible to newcomers.
Essential Features
- Authentic Sino-Platinum Financial Data: Gain access to precise historical records and future forecasts.
- Adjustable Forecast Parameters: Modify highlighted fields such as WACC, growth rates, and profit margins.
- Real-Time Calculations: Instant updates for DCF, Net Present Value (NPV), and cash flow evaluations.
- Interactive Dashboard: User-friendly charts and summaries to clearly display your valuation outcomes.
- Designed for All Users: An intuitive layout tailored for investors, CFOs, and consultants alike.
How It Works
- Step 1: Download the prebuilt Excel template containing data for Sino-Platinum Metals Co., Ltd (600459SS).
- Step 2: Review the pre-filled sheets to familiarize yourself with the key financial metrics.
- Step 3: Modify the forecasts and assumptions in the editable yellow cells (WACC, growth, margins).
- Step 4: Instantly see the updated results, including the intrinsic value of Sino-Platinum Metals Co., Ltd (600459SS).
- Step 5: Utilize the outputs to make informed investment decisions or create detailed reports.
Why Choose Sino-Platinum Metals Co., Ltd (600459SS) Calculator?
- Precision: Accurate data derived from real Sino-Platinum financials ensures reliability.
- Adaptability: Tailored for users to easily test and adjust inputs as needed.
- Efficiency: Avoid the complexities of building a DCF model from the ground up.
- Industry-Standard: Crafted with the expertise and usability expected at the CFO level.
- Intuitive: Simple to navigate, suitable for users with varying levels of financial modeling expertise.
Who Can Benefit from Sino-Platinum Metals Co., Ltd (600459SS)?
- Investors: Make informed choices with a top-tier analysis tool tailored for precious metals investments.
- Financial Analysts: Increase efficiency with a ready-made DCF model that you can easily tailor to your needs.
- Consultants: Seamlessly modify the template for client reports or presentations in the metals sector.
- Finance Enthusiasts: Enhance your grasp of valuation methods through practical, real-world scenarios involving Sino-Platinum Metals.
- Educators and Students: Utilize this resource as a hands-on learning aid in finance or investment courses.
Contents of the Template
- Historical Data: Features Sino-Platinum's previous financial performance and foundational forecasts.
- DCF and Levered DCF Models: Comprehensive templates for determining Sino-Platinum’s intrinsic value.
- WACC Sheet: Ready-to-use calculations for the Weighted Average Cost of Capital.
- Editable Inputs: Adjust critical drivers such as growth rates, EBITDA %, and CAPEX estimates.
- Quarterly and Annual Statements: Detailed analysis of Sino-Platinum’s financial statements.
- Interactive Dashboard: Dynamically visualize valuation results and future projections.
Disclaimer
All information, articles, and product details provided on this website are for general informational and educational purposes only. We do not claim any ownership over, nor do we intend to infringe upon, any trademarks, copyrights, logos, brand names, or other intellectual property mentioned or depicted on this site. Such intellectual property remains the property of its respective owners, and any references here are made solely for identification or informational purposes, without implying any affiliation, endorsement, or partnership.
We make no representations or warranties, express or implied, regarding the accuracy, completeness, or suitability of any content or products presented. Nothing on this website should be construed as legal, tax, investment, financial, medical, or other professional advice. In addition, no part of this site—including articles or product references—constitutes a solicitation, recommendation, endorsement, advertisement, or offer to buy or sell any securities, franchises, or other financial instruments, particularly in jurisdictions where such activity would be unlawful.
All content is of a general nature and may not address the specific circumstances of any individual or entity. It is not a substitute for professional advice or services. Any actions you take based on the information provided here are strictly at your own risk. You accept full responsibility for any decisions or outcomes arising from your use of this website and agree to release us from any liability in connection with your use of, or reliance upon, the content or products found herein.