
|
Hangzhou Silan Microelectronics Co., Ltd (600460.SS) Valoración de DCF |
Completamente Editable: Adáptelo A Sus Necesidades En Excel O Sheets
Diseño Profesional: Plantillas Confiables Y Estándares De La Industria
Predeterminadas Para Un Uso Rápido Y Eficiente
Compatible con MAC / PC, completamente desbloqueado
No Se Necesita Experiencia; Fáciles De Seguir
Hangzhou Silan Microelectronics Co., Ltd (600460.SS) Bundle
¿Busca determinar el valor intrínseco de Hangzhou Silan Microelectronics Co., Ltd? Nuestra calculadora DCF (600460SS) integra datos del mundo real con extensas funciones de personalización, lo que le permite ajustar los pronósticos y mejorar sus opciones de inversión.
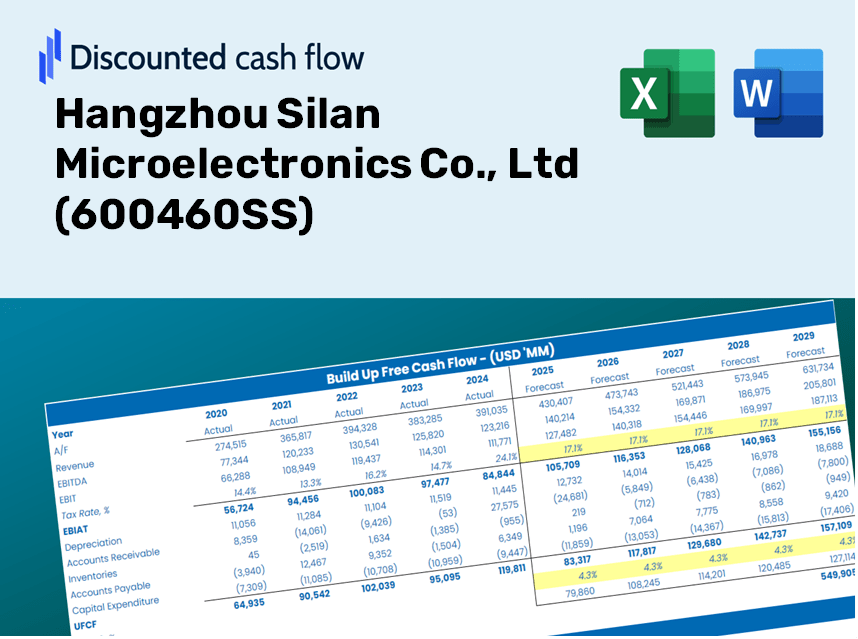
Discounted Cash Flow (DCF) - (USD MM)
| Year | AY1 2020 |
AY2 2021 |
AY3 2022 |
AY4 2023 |
AY5 2024 |
FY1 2025 |
FY2 2026 |
FY3 2027 |
FY4 2028 |
FY5 2029 |
|---|---|---|---|---|---|---|---|---|---|---|
| Revenue | 4,280.6 | 7,194.1 | 8,282.2 | 9,339.5 | 11,220.9 | 14,477.7 | 18,679.9 | 24,101.7 | 31,097.2 | 40,123.1 |
| Revenue Growth, % | 0 | 68.07 | 15.12 | 12.77 | 20.14 | 29.02 | 29.02 | 29.02 | 29.02 | 29.02 |
| EBITDA | 464.4 | 1,765.3 | 1,787.2 | 1,459.7 | 1,418.4 | 2,468.0 | 3,184.3 | 4,108.6 | 5,301.1 | 6,839.7 |
| EBITDA, % | 10.85 | 24.54 | 21.58 | 15.63 | 12.64 | 17.05 | 17.05 | 17.05 | 17.05 | 17.05 |
| Depreciation | 452.1 | 512.3 | 707.2 | 886.1 | 1,213.3 | 1,347.1 | 1,738.1 | 2,242.5 | 2,893.4 | 3,733.2 |
| Depreciation, % | 10.56 | 7.12 | 8.54 | 9.49 | 10.81 | 9.3 | 9.3 | 9.3 | 9.3 | 9.3 |
| EBIT | 12.3 | 1,252.9 | 1,079.9 | 573.6 | 205.1 | 1,120.9 | 1,446.3 | 1,866.1 | 2,407.7 | 3,106.5 |
| EBIT, % | 0.28796 | 17.42 | 13.04 | 6.14 | 1.83 | 7.74 | 7.74 | 7.74 | 7.74 | 7.74 |
| Total Cash | 1,110.5 | 2,348.5 | 2,232.4 | 6,131.2 | 4,520.3 | 5,544.2 | 7,153.4 | 9,229.7 | 11,908.6 | 15,365.1 |
| Total Cash, percent | .0 | .0 | .0 | .0 | .0 | .0 | .0 | .0 | .0 | .0 |
| Account Receivables | 1,787.6 | 2,483.1 | 2,804.0 | 3,384.5 | 4,571.9 | 5,418.0 | 6,990.6 | 9,019.6 | 11,637.5 | 15,015.3 |
| Account Receivables, % | 41.76 | 34.51 | 33.86 | 36.24 | 40.74 | 37.42 | 37.42 | 37.42 | 37.42 | 37.42 |
| Inventories | 1,387.9 | 1,912.9 | 3,071.8 | 3,732.0 | 3,898.9 | 4,945.9 | 6,381.4 | 8,233.6 | 10,623.4 | 13,706.8 |
| Inventories, % | 32.42 | 26.59 | 37.09 | 39.96 | 34.75 | 34.16 | 34.16 | 34.16 | 34.16 | 34.16 |
| Accounts Payable | 914.1 | 1,421.3 | 1,727.6 | 2,055.1 | 3,101.6 | 3,231.9 | 4,170.0 | 5,380.3 | 6,941.9 | 8,956.8 |
| Accounts Payable, % | 21.36 | 19.76 | 20.86 | 22 | 27.64 | 22.32 | 22.32 | 22.32 | 22.32 | 22.32 |
| Capital Expenditure | -640.4 | -947.8 | -1,566.2 | -1,137.3 | -1,787.1 | -2,176.0 | -2,807.5 | -3,622.4 | -4,673.8 | -6,030.4 |
| Capital Expenditure, % | -14.96 | -13.17 | -18.91 | -12.18 | -15.93 | -15.03 | -15.03 | -15.03 | -15.03 | -15.03 |
| Tax Rate, % | 305.01 | 305.01 | 305.01 | 305.01 | 305.01 | 305.01 | 305.01 | 305.01 | 305.01 | 305.01 |
| EBITAT | -22.1 | 1,098.8 | 953.2 | 360.9 | -420.4 | 535.5 | 691.0 | 891.5 | 1,150.3 | 1,484.2 |
| Depreciation | ||||||||||
| Changes in Account Receivables | ||||||||||
| Changes in Inventories | ||||||||||
| Changes in Accounts Payable | ||||||||||
| Capital Expenditure | ||||||||||
| UFCF | -2,471.8 | -50.0 | -1,079.2 | -803.5 | -1,302.1 | -2,056.0 | -2,448.5 | -3,159.2 | -4,076.2 | -5,259.3 |
| WACC, % | 7.14 | 7.56 | 7.56 | 7.44 | 7.14 | 7.37 | 7.37 | 7.37 | 7.37 | 7.37 |
| PV UFCF | ||||||||||
| SUM PV UFCF | -13,345.5 | |||||||||
| Long Term Growth Rate, % | 3.50 | |||||||||
| Free cash flow (T + 1) | -5,443 | |||||||||
| Terminal Value | -140,801 | |||||||||
| Present Terminal Value | -98,690 | |||||||||
| Enterprise Value | -112,035 | |||||||||
| Net Debt | -421 | |||||||||
| Equity Value | -111,615 | |||||||||
| Diluted Shares Outstanding, MM | 1,691 | |||||||||
| Equity Value Per Share | -65.99 |
Benefits You Will Receive
- Customizable Excel Template: An entirely adjustable Excel-based DCF Calculator featuring pre-filled financial data for Hangzhou Silan Microelectronics Co., Ltd (600460SS).
- Accurate Data: Access to historical figures and forward-looking projections (highlighted in the yellow cells).
- Flexible Forecasting: Modify key assumptions such as revenue growth, EBITDA percentage, and WACC.
- Instant Calculations: Monitor the effects of your inputs on the valuation of Hangzhou Silan Microelectronics Co., Ltd (600460SS) in real-time.
- Professional-Grade Tool: Designed for investors, CFOs, consultants, and financial analysts.
- Intuitive Layout: Organized for simplicity and user-friendliness, complete with step-by-step guidance.
Key Features
- 🔍 Real-Life HSMC Financials: Pre-filled historical and projected data for Hangzhou Silan Microelectronics Co., Ltd (600460SS).
- ✏️ Fully Customizable Inputs: Adjust all critical parameters (yellow cells) such as WACC, growth %, and tax rates.
- 📊 Professional DCF Valuation: Integrated formulas calculate HSMC’s intrinsic value using the Discounted Cash Flow method.
- ⚡ Instant Results: Visualize HSMC’s valuation immediately after making adjustments.
- Scenario Analysis: Evaluate and compare results for different financial assumptions side-by-side.
How It Functions
- 1. Access the Template: Download and open the Excel file containing Silan Microelectronics' preloaded data.
- 2. Modify Assumptions: Adjust critical inputs such as growth rates, WACC, and capital investments.
- 3. See Results Instantly: The DCF model automatically computes intrinsic value and NPV.
- 4. Explore Scenarios: Evaluate various forecasts to assess different valuation results.
- 5. Utilize with Assurance: Share professional valuation insights to bolster your decision-making process.
Why Opt for Hangzhou Silan Microelectronics Co., Ltd (600460SS)?
- Efficiency Boost: Skip the hassle of building a financial model from the ground up – our tools are ready for immediate application.
- Enhanced Precision: Our dependable financial data and formulas minimize inaccuracies in your evaluations.
- Completely Adjustable: Modify the model to align with your specific assumptions and forecasts.
- User-Friendly: Intuitive charts and outputs ensure results are straightforward and easy to comprehend.
- Endorsed by Professionals: Crafted for those who prioritize accuracy and functionality in their financial analysis.
Who Can Benefit from This Product?
- Finance Students: Master valuation techniques and apply them to real-world data.
- Academics: Utilize professional models for your coursework or scholarly research.
- Investors: Evaluate your assumptions and assess valuation outcomes for Hangzhou Silan Microelectronics Co., Ltd (600460SS).
- Analysts: Enhance your efficiency with a customizable DCF model designed for your needs.
- Small Business Owners: Discover how large public companies like Hangzhou Silan Microelectronics Co., Ltd (600460SS) are analyzed for investment decisions.
Contents of the Template
- Pre-Filled DCF Model: Hangzhou Silan Microelectronics Co., Ltd’s (600460SS) financial data preconfigured for immediate analysis.
- WACC Calculator: Comprehensive calculations for the Weighted Average Cost of Capital tailored for the company.
- Financial Ratios: Assess Hangzhou Silan’s (600460SS) profitability, leverage, and operational efficiency.
- Editable Inputs: Modify assumptions like growth rates, profit margins, and CAPEX to suit your analysis needs.
- Financial Statements: Access annual and quarterly reports for thorough financial evaluation.
- Interactive Dashboard: Effortlessly visualize essential valuation metrics and outcomes.
Disclaimer
All information, articles, and product details provided on this website are for general informational and educational purposes only. We do not claim any ownership over, nor do we intend to infringe upon, any trademarks, copyrights, logos, brand names, or other intellectual property mentioned or depicted on this site. Such intellectual property remains the property of its respective owners, and any references here are made solely for identification or informational purposes, without implying any affiliation, endorsement, or partnership.
We make no representations or warranties, express or implied, regarding the accuracy, completeness, or suitability of any content or products presented. Nothing on this website should be construed as legal, tax, investment, financial, medical, or other professional advice. In addition, no part of this site—including articles or product references—constitutes a solicitation, recommendation, endorsement, advertisement, or offer to buy or sell any securities, franchises, or other financial instruments, particularly in jurisdictions where such activity would be unlawful.
All content is of a general nature and may not address the specific circumstances of any individual or entity. It is not a substitute for professional advice or services. Any actions you take based on the information provided here are strictly at your own risk. You accept full responsibility for any decisions or outcomes arising from your use of this website and agree to release us from any liability in connection with your use of, or reliance upon, the content or products found herein.