
|
Shuangliang Eco-Ennergy Systems Co., Ltd (600481.SS) Valoración de DCF |
Completamente Editable: Adáptelo A Sus Necesidades En Excel O Sheets
Diseño Profesional: Plantillas Confiables Y Estándares De La Industria
Predeterminadas Para Un Uso Rápido Y Eficiente
Compatible con MAC / PC, completamente desbloqueado
No Se Necesita Experiencia; Fáciles De Seguir
Shuangliang Eco-Energy Systems Co.,Ltd (600481.SS) Bundle
Diseñada para la precisión, nuestra calculadora DCF (600481SS) le permite evaluar la valoración de Shuangliang Eco-Ennergy Systems Co., Ltd utilizando datos financieros del mundo real, que ofrece una flexibilidad completa para modificar todos los parámetros clave para las proyecciones mejoradas.
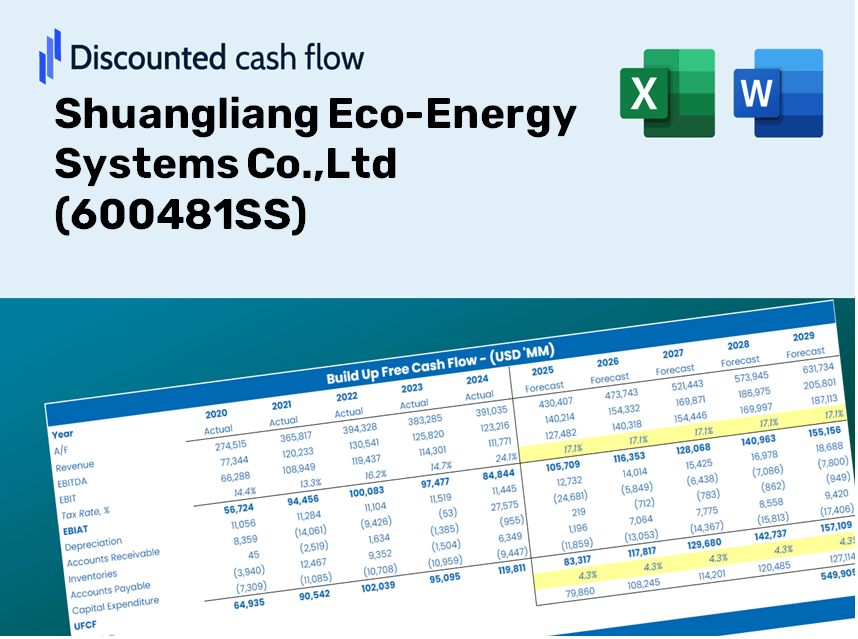
Discounted Cash Flow (DCF) - (USD MM)
| Year | AY1 2020 |
AY2 2021 |
AY3 2022 |
AY4 2023 |
AY5 2024 |
FY1 2025 |
FY2 2026 |
FY3 2027 |
FY4 2028 |
FY5 2029 |
|---|---|---|---|---|---|---|---|---|---|---|
| Revenue | 2,071.6 | 3,829.8 | 14,476.4 | 23,149.3 | 13,037.8 | 19,592.7 | 29,443.2 | 44,246.2 | 66,491.6 | 99,921.1 |
| Revenue Growth, % | 0 | 84.87 | 277.99 | 59.91 | -43.68 | 50.28 | 50.28 | 50.28 | 50.28 | 50.28 |
| EBITDA | 197.8 | 442.0 | 1,585.9 | 2,713.1 | -1,112.3 | 1,380.7 | 2,074.9 | 3,118.0 | 4,685.7 | 7,041.4 |
| EBITDA, % | 9.55 | 11.54 | 10.96 | 11.72 | -8.53 | 7.05 | 7.05 | 7.05 | 7.05 | 7.05 |
| Depreciation | 54.8 | 66.5 | 297.0 | 722.4 | 942.2 | 657.5 | 988.1 | 1,484.9 | 2,231.4 | 3,353.2 |
| Depreciation, % | 2.64 | 1.74 | 2.05 | 3.12 | 7.23 | 3.36 | 3.36 | 3.36 | 3.36 | 3.36 |
| EBIT | 143.1 | 375.4 | 1,289.0 | 1,990.7 | -2,054.5 | 723.2 | 1,086.8 | 1,633.2 | 2,454.3 | 3,688.2 |
| EBIT, % | 6.91 | 9.8 | 8.9 | 8.6 | -15.76 | 3.69 | 3.69 | 3.69 | 3.69 | 3.69 |
| Total Cash | 1,230.3 | 1,923.6 | 4,814.1 | 8,534.8 | 6,173.8 | 8,898.8 | 13,372.8 | 20,096.1 | 30,199.6 | 45,382.9 |
| Total Cash, percent | .0 | .0 | .0 | .0 | .0 | .0 | .0 | .0 | .0 | .0 |
| Account Receivables | 1,310.1 | 1,568.5 | 2,635.6 | 2,710.2 | 2,663.1 | 6,055.6 | 9,100.1 | 13,675.3 | 20,550.7 | 30,882.8 |
| Account Receivables, % | 63.24 | 40.95 | 18.21 | 11.71 | 20.43 | 30.91 | 30.91 | 30.91 | 30.91 | 30.91 |
| Inventories | 443.4 | 1,052.8 | 2,840.6 | 1,851.1 | 1,551.8 | 3,464.6 | 5,206.4 | 7,824.1 | 11,757.7 | 17,669.0 |
| Inventories, % | 21.41 | 27.49 | 19.62 | 8 | 11.9 | 17.68 | 17.68 | 17.68 | 17.68 | 17.68 |
| Accounts Payable | 696.4 | 1,737.7 | 4,600.8 | 7,601.7 | 4,737.6 | 7,051.3 | 10,596.5 | 15,924.0 | 23,930.0 | 35,961.2 |
| Accounts Payable, % | 33.62 | 45.37 | 31.78 | 32.84 | 36.34 | 35.99 | 35.99 | 35.99 | 35.99 | 35.99 |
| Capital Expenditure | -21.9 | -864.3 | -665.5 | -3,585.7 | -256.4 | -1,790.0 | -2,689.9 | -4,042.3 | -6,074.6 | -9,128.7 |
| Capital Expenditure, % | -1.06 | -22.57 | -4.6 | -15.49 | -1.97 | -9.14 | -9.14 | -9.14 | -9.14 | -9.14 |
| Tax Rate, % | 16.15 | 16.15 | 16.15 | 16.15 | 16.15 | 16.15 | 16.15 | 16.15 | 16.15 | 16.15 |
| EBITAT | 118.1 | 285.7 | 1,006.3 | 1,599.9 | -1,722.6 | 579.9 | 871.4 | 1,309.5 | 1,967.9 | 2,957.3 |
| Depreciation | ||||||||||
| Changes in Account Receivables | ||||||||||
| Changes in Inventories | ||||||||||
| Changes in Accounts Payable | ||||||||||
| Capital Expenditure | ||||||||||
| UFCF | -906.1 | -338.6 | 645.9 | 2,652.4 | -3,554.5 | -3,544.1 | -2,071.6 | -3,113.2 | -4,678.4 | -7,030.5 |
| WACC, % | 4.58 | 4.43 | 4.48 | 4.53 | 4.61 | 4.53 | 4.53 | 4.53 | 4.53 | 4.53 |
| PV UFCF | ||||||||||
| SUM PV UFCF | -17,566.2 | |||||||||
| Long Term Growth Rate, % | 3.50 | |||||||||
| Free cash flow (T + 1) | -7,277 | |||||||||
| Terminal Value | -708,783 | |||||||||
| Present Terminal Value | -568,039 | |||||||||
| Enterprise Value | -585,606 | |||||||||
| Net Debt | 4,086 | |||||||||
| Equity Value | -589,692 | |||||||||
| Diluted Shares Outstanding, MM | 2,173 | |||||||||
| Equity Value Per Share | -271.43 |
What You Will Receive
- Accurate 600481SS Financials: Access to both historical and projected data for precise valuation.
- Customizable Inputs: Adjust WACC, tax rates, revenue growth, and capital expenditures to fit your analysis.
- Instant Calculations: Automatically computes intrinsic value and NPV in real-time.
- Scenario Analysis: Explore various scenarios to assess the future performance of Shuangliang Eco-Energy Systems.
- User-Friendly Interface: Designed for professionals but easy enough for newcomers to navigate.
Key Features
- Authentic Shuangliang Financial Data: Gain access to reliable, pre-loaded historical figures and future forecasts.
- Flexible Forecast Parameters: Customize highlighted fields for WACC, growth rates, and margins to suit your analysis.
- Real-Time Calculations: Experience automatic updates for DCF, Net Present Value (NPV), and cash flow analyses.
- Interactive Dashboard: Enjoy visually engaging charts and summaries to easily interpret your valuation outcomes.
- Designed for All Skill Levels: An intuitive layout tailored for investors, CFOs, and consultants alike.
How It Operates
- Download: Get the pre-configured Excel file containing Shuangliang Eco-Energy's financial data.
- Customize: Adapt projections, including revenue growth, EBITDA margin, and WACC.
- Update Automatically: Watch as intrinsic value and NPV calculations refresh in real-time.
- Test Scenarios: Generate various forecasts and compare results instantly.
- Make Decisions: Leverage the valuation insights to shape your investment approach.
Why Choose This Calculator for Shuangliang Eco-Energy Systems Co., Ltd (600481SS)?
- Reliable Data: Accurate financial information on Shuangliang ensures dependable valuation outcomes.
- Customizable Features: Tailor vital parameters such as growth rates, WACC, and tax rates to align with your forecasts.
- Efficiency Boost: Built-in calculations save you the hassle of starting from the beginning.
- Professional-Quality Tool: Crafted for investors, analysts, and consultants focused on Shuangliang Eco-Energy Systems.
- Easy to Use: User-friendly design with clear instructions makes it accessible for all experience levels.
Who Can Benefit from This Product?
- Finance Students: Understand valuation methodologies and practice with authentic data related to Shuangliang Eco-Energy Systems Co., Ltd (600481SS).
- Researchers: Utilize advanced models for your academic studies or projects involving eco-energy systems.
- Investors: Validate your investment hypotheses and evaluate the valuation results of Shuangliang Eco-Energy Systems Co., Ltd (600481SS).
- Market Analysts: Enhance your productivity with a ready-to-use, adaptable DCF model tailored for eco-energy companies.
- Entrepreneurs: Discover how established firms like Shuangliang Eco-Energy Systems Co., Ltd (600481SS) are assessed in the market.
What the Template Contains for Shuangliang Eco-Energy Systems Co.,Ltd (600481SS)
- Historical Data: Contains Shuangliang's previous financial performance and foundational forecasts.
- DCF and Levered DCF Models: Comprehensive templates for assessing Shuangliang's intrinsic value.
- WACC Sheet: Pre-assembled calculations for the Weighted Average Cost of Capital.
- Editable Inputs: Adjust critical drivers such as growth rates, EBITDA percentages, and CAPEX assumptions.
- Quarterly and Annual Statements: A thorough analysis of Shuangliang's financials.
- Interactive Dashboard: Dynamically visualize valuation outcomes and forecasts.
Disclaimer
All information, articles, and product details provided on this website are for general informational and educational purposes only. We do not claim any ownership over, nor do we intend to infringe upon, any trademarks, copyrights, logos, brand names, or other intellectual property mentioned or depicted on this site. Such intellectual property remains the property of its respective owners, and any references here are made solely for identification or informational purposes, without implying any affiliation, endorsement, or partnership.
We make no representations or warranties, express or implied, regarding the accuracy, completeness, or suitability of any content or products presented. Nothing on this website should be construed as legal, tax, investment, financial, medical, or other professional advice. In addition, no part of this site—including articles or product references—constitutes a solicitation, recommendation, endorsement, advertisement, or offer to buy or sell any securities, franchises, or other financial instruments, particularly in jurisdictions where such activity would be unlawful.
All content is of a general nature and may not address the specific circumstances of any individual or entity. It is not a substitute for professional advice or services. Any actions you take based on the information provided here are strictly at your own risk. You accept full responsibility for any decisions or outcomes arising from your use of this website and agree to release us from any liability in connection with your use of, or reliance upon, the content or products found herein.