
|
Fangda Special Steel Technology Co., Ltd. (600507.SS) Valoración de DCF |
Completamente Editable: Adáptelo A Sus Necesidades En Excel O Sheets
Diseño Profesional: Plantillas Confiables Y Estándares De La Industria
Predeterminadas Para Un Uso Rápido Y Eficiente
Compatible con MAC / PC, completamente desbloqueado
No Se Necesita Experiencia; Fáciles De Seguir
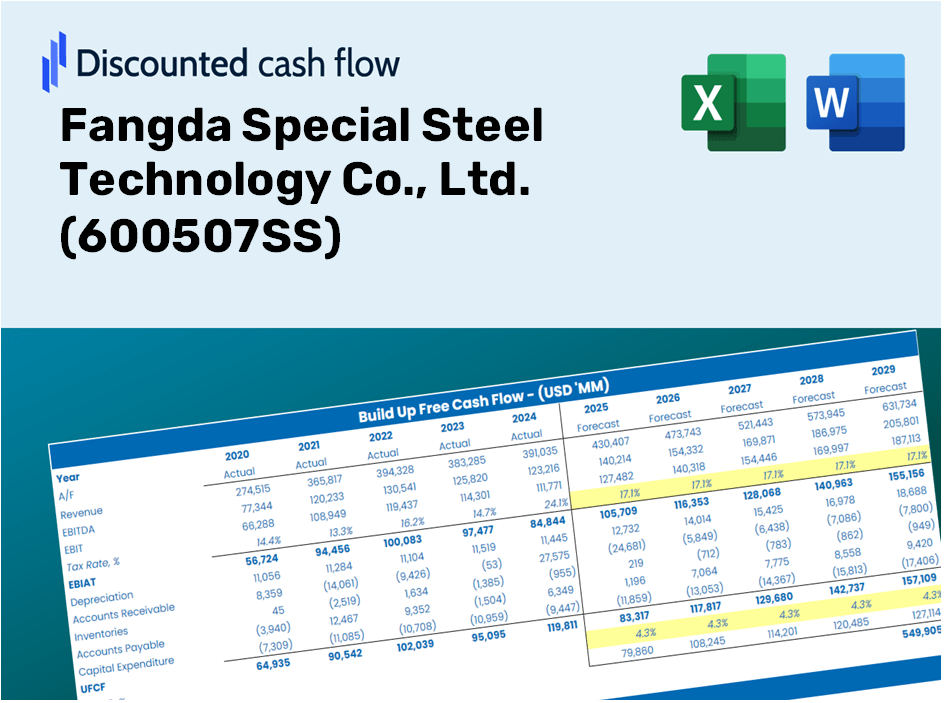
Fangda Special Steel Technology Co., Ltd. (600507.SS) Bundle
¡Mejore sus estrategias de inversión con la calculadora DCF (600507SS)! Explore datos financieros auténticos para Fangda Special Steel Technology Co., Ltd., ajuste las proyecciones y gastos de crecimiento, y observe instantáneamente cómo estos cambios afectan el valor intrínseco de (600507SS).
Discounted Cash Flow (DCF) - (USD MM)
| Year | AY1 2020 |
AY2 2021 |
AY3 2022 |
AY4 2023 |
AY5 2024 |
FY1 2025 |
FY2 2026 |
FY3 2027 |
FY4 2028 |
FY5 2029 |
|---|---|---|---|---|---|---|---|---|---|---|
| Revenue | 16,601.5 | 21,679.4 | 23,238.6 | 26,507.3 | 21,559.5 | 21,473.5 | 21,387.8 | 21,302.5 | 21,217.5 | 21,132.8 |
| Revenue Growth, % | 0 | 30.59 | 7.19 | 14.07 | -18.67 | -0.39901 | -0.39901 | -0.39901 | -0.39901 | -0.39901 |
| EBITDA | 3,558.7 | 4,234.3 | 1,923.8 | 1,464.2 | 969.7 | 2,545.3 | 2,535.2 | 2,525.1 | 2,515.0 | 2,505.0 |
| EBITDA, % | 21.44 | 19.53 | 8.28 | 5.52 | 4.5 | 11.85 | 11.85 | 11.85 | 11.85 | 11.85 |
| Depreciation | 504.7 | 470.8 | 453.4 | 435.4 | 473.5 | 472.5 | 470.6 | 468.7 | 466.8 | 465.0 |
| Depreciation, % | 3.04 | 2.17 | 1.95 | 1.64 | 2.2 | 2.2 | 2.2 | 2.2 | 2.2 | 2.2 |
| EBIT | 3,054.0 | 3,763.5 | 1,470.4 | 1,028.9 | 496.2 | 2,072.9 | 2,064.6 | 2,056.4 | 2,048.2 | 2,040.0 |
| EBIT, % | 18.4 | 17.36 | 6.33 | 3.88 | 2.3 | 9.65 | 9.65 | 9.65 | 9.65 | 9.65 |
| Total Cash | 6,478.4 | 10,440.3 | 6,262.0 | 6,360.3 | 6,266.8 | 7,180.3 | 7,151.6 | 7,123.1 | 7,094.7 | 7,066.4 |
| Total Cash, percent | .0 | .0 | .0 | .0 | .0 | .0 | .0 | .0 | .0 | .0 |
| Account Receivables | 1,339.4 | 3,760.7 | 1,117.7 | 2,312.0 | 2,309.4 | 2,132.7 | 2,124.2 | 2,115.7 | 2,107.2 | 2,098.8 |
| Account Receivables, % | 8.07 | 17.35 | 4.81 | 8.72 | 10.71 | 9.93 | 9.93 | 9.93 | 9.93 | 9.93 |
| Inventories | 1,337.3 | 1,479.9 | 1,637.8 | 1,773.5 | 1,380.8 | 1,504.2 | 1,498.2 | 1,492.2 | 1,486.3 | 1,480.3 |
| Inventories, % | 8.06 | 6.83 | 7.05 | 6.69 | 6.4 | 7 | 7 | 7 | 7 | 7 |
| Accounts Payable | 2,664.1 | 5,500.1 | 6,069.2 | 7,182.7 | 7,255.7 | 5,509.5 | 5,487.5 | 5,465.6 | 5,443.8 | 5,422.1 |
| Accounts Payable, % | 16.05 | 25.37 | 26.12 | 27.1 | 33.65 | 25.66 | 25.66 | 25.66 | 25.66 | 25.66 |
| Capital Expenditure | -147.9 | -105.9 | -92.2 | -88.7 | -51.3 | -100.9 | -100.5 | -100.1 | -99.7 | -99.3 |
| Capital Expenditure, % | -0.89105 | -0.48861 | -0.39666 | -0.33451 | -0.23772 | -0.46971 | -0.46971 | -0.46971 | -0.46971 | -0.46971 |
| Tax Rate, % | 47.16 | 47.16 | 47.16 | 47.16 | 47.16 | 47.16 | 47.16 | 47.16 | 47.16 | 47.16 |
| EBITAT | 2,127.2 | 2,826.2 | 1,396.5 | 733.4 | 262.2 | 1,508.4 | 1,502.4 | 1,496.4 | 1,490.4 | 1,484.5 |
| Depreciation | ||||||||||
| Changes in Account Receivables | ||||||||||
| Changes in Inventories | ||||||||||
| Changes in Accounts Payable | ||||||||||
| Capital Expenditure | ||||||||||
| UFCF | 2,471.3 | 3,463.2 | 4,812.0 | 863.5 | 1,152.7 | 187.1 | 1,865.0 | 1,857.6 | 1,850.2 | 1,842.8 |
| WACC, % | 6.17 | 6.22 | 6.41 | 6.18 | 6.01 | 6.2 | 6.2 | 6.2 | 6.2 | 6.2 |
| PV UFCF | ||||||||||
| SUM PV UFCF | 6,200.0 | |||||||||
| Long Term Growth Rate, % | 2.00 | |||||||||
| Free cash flow (T + 1) | 1,880 | |||||||||
| Terminal Value | 44,787 | |||||||||
| Present Terminal Value | 33,158 | |||||||||
| Enterprise Value | 39,358 | |||||||||
| Net Debt | -5,268 | |||||||||
| Equity Value | 44,626 | |||||||||
| Diluted Shares Outstanding, MM | 2,274 | |||||||||
| Equity Value Per Share | 19.63 |
Benefits You Will Experience
- Dynamic Input Options: Seamlessly adjust key variables (growth %, margins, WACC) to explore various scenarios.
- Comprehensive Data Access: Fangda Special Steel Technology Co., Ltd.'s financial data pre-loaded for a streamlined analysis.
- Automated DCF Calculations: The template generates Net Present Value (NPV) and intrinsic value calculations automatically.
- Tailored and Professional Design: A sophisticated Excel model that caters to your specific valuation requirements.
- Designed for Analysts and Investors: Perfect for evaluating forecasts, validating investment strategies, and enhancing efficiency.
Key Features
- Accurate Financial Data: Gain access to reliable pre-loaded historical figures and future forecasts for Fangda Special Steel Technology Co., Ltd. (600507SS).
- Tailored Forecast Assumptions: Modify the highlighted cells for parameters such as WACC, growth rates, and profit margins.
- Automatic Calculations: Real-time updates for DCF, Net Present Value (NPV), and comprehensive cash flow analysis.
- User-Friendly Dashboard: Intuitive charts and summaries for clear visualization of your valuation findings.
- Designed for All Skill Levels: An accessible layout suitable for investors, CFOs, and consultants alike.
How It Works
- Step 1: Download the Excel file.
- Step 2: Examine Fangda Special Steel Technology Co., Ltd.'s pre-filled financial data and projections.
- Step 3: Adjust key inputs such as revenue growth, WACC, and tax rates (highlighted cells).
- Step 4: Observe the DCF model refresh in real-time as you modify your assumptions.
- Step 5: Evaluate the outputs and leverage the insights for your investment decisions.
Why Choose This Calculator for Fangda Special Steel Technology Co., Ltd. (600507SS)?
- User-Friendly Interface: Perfect for both novices and seasoned professionals.
- Customizable Inputs: Adjust parameters effortlessly to suit your financial analysis.
- Real-Time Valuation: Instantly view adjustments to Fangda’s valuation as you change inputs.
- Preloaded Data: Comes equipped with Fangda’s actual financial metrics for rapid assessments.
- Preferred by Experts: Utilized by investors and analysts for informed decision-making.
Who Can Benefit from Fangda Special Steel Technology Co., Ltd. (600507SS)?
- Investors: Make informed choices with a top-tier valuation tool tailored for the steel industry.
- Financial Analysts: Streamline your workflow with a customizable DCF model designed specifically for Fangda's financials.
- Consultants: Effortlessly modify the template for presentations or reports for your clients in the manufacturing sector.
- Steel Industry Enthusiasts: Enhance your knowledge of valuation methods through practical, real-world illustrations related to Fangda.
- Educators and Students: Utilize this resource as a hands-on learning aid in finance and manufacturing courses.
Contents of the Template
- Detailed DCF Model: Editable framework featuring comprehensive valuation calculations.
- Historical and Projected Data: Fangda Special Steel's financials from past and future are preloaded for in-depth analysis.
- Adjustable Variables: Modify WACC, growth rates, and tax assumptions to explore different scenarios.
- Financial Statements Overview: Complete annual and quarterly reports for enhanced understanding.
- Essential Ratios: Integrated analysis of profitability, efficiency, and leverage metrics.
- Visual Dashboard: Charts and tables presenting clear, actionable insights.
Disclaimer
All information, articles, and product details provided on this website are for general informational and educational purposes only. We do not claim any ownership over, nor do we intend to infringe upon, any trademarks, copyrights, logos, brand names, or other intellectual property mentioned or depicted on this site. Such intellectual property remains the property of its respective owners, and any references here are made solely for identification or informational purposes, without implying any affiliation, endorsement, or partnership.
We make no representations or warranties, express or implied, regarding the accuracy, completeness, or suitability of any content or products presented. Nothing on this website should be construed as legal, tax, investment, financial, medical, or other professional advice. In addition, no part of this site—including articles or product references—constitutes a solicitation, recommendation, endorsement, advertisement, or offer to buy or sell any securities, franchises, or other financial instruments, particularly in jurisdictions where such activity would be unlawful.
All content is of a general nature and may not address the specific circumstances of any individual or entity. It is not a substitute for professional advice or services. Any actions you take based on the information provided here are strictly at your own risk. You accept full responsibility for any decisions or outcomes arising from your use of this website and agree to release us from any liability in connection with your use of, or reliance upon, the content or products found herein.