
|
JCET Group Co., Ltd. (600584.ss) Valoración de DCF |
Completamente Editable: Adáptelo A Sus Necesidades En Excel O Sheets
Diseño Profesional: Plantillas Confiables Y Estándares De La Industria
Predeterminadas Para Un Uso Rápido Y Eficiente
Compatible con MAC / PC, completamente desbloqueado
No Se Necesita Experiencia; Fáciles De Seguir
JCET Group Co., Ltd. (600584.SS) Bundle
Diseñada para la precisión, nuestra calculadora DCF (600584SS) le permite evaluar JCET Group Co., Ltd. Valoración utilizando datos financieros del mundo real y ofrece una flexibilidad completa para modificar todos los parámetros esenciales para mejorar las proyecciones.
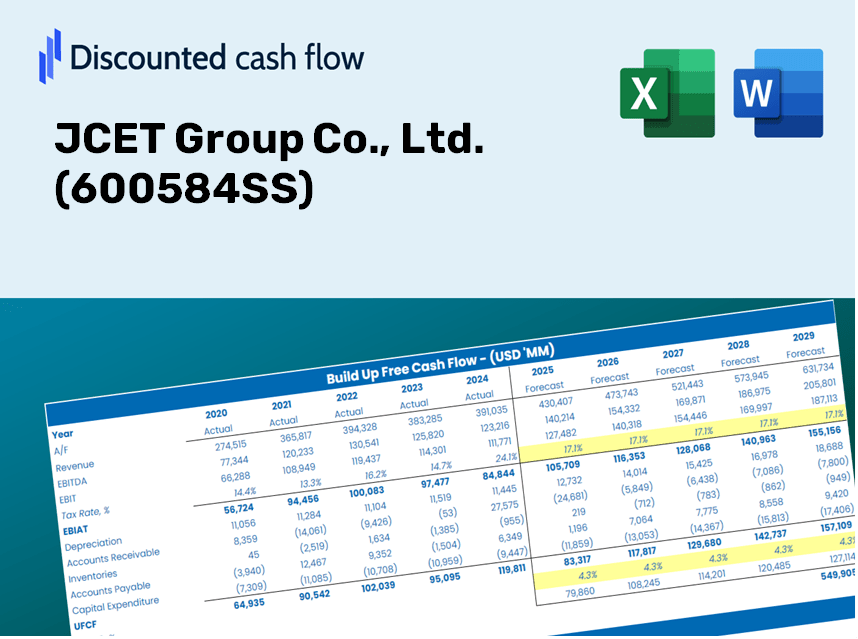
Discounted Cash Flow (DCF) - (USD MM)
| Year | AY1 2020 |
AY2 2021 |
AY3 2022 |
AY4 2023 |
AY5 2024 |
FY1 2025 |
FY2 2026 |
FY3 2027 |
FY4 2028 |
FY5 2029 |
|---|---|---|---|---|---|---|---|---|---|---|
| Revenue | 26,464.0 | 30,502.4 | 33,762.0 | 29,661.0 | 35,961.7 | 39,112.1 | 42,538.5 | 46,265.1 | 50,318.1 | 54,726.2 |
| Revenue Growth, % | 0 | 15.26 | 10.69 | -12.15 | 21.24 | 8.76 | 8.76 | 8.76 | 8.76 | 8.76 |
| EBITDA | 5,047.9 | 6,586.8 | 6,710.5 | 5,048.5 | 5,266.3 | 7,213.0 | 7,844.9 | 8,532.1 | 9,279.6 | 10,092.5 |
| EBITDA, % | 19.07 | 21.59 | 19.88 | 17.02 | 14.64 | 18.44 | 18.44 | 18.44 | 18.44 | 18.44 |
| Depreciation | 3,355.7 | 3,549.7 | 3,664.4 | 3,444.9 | 3,506.9 | 4,422.6 | 4,810.0 | 5,231.4 | 5,689.7 | 6,188.1 |
| Depreciation, % | 12.68 | 11.64 | 10.85 | 11.61 | 9.75 | 11.31 | 11.31 | 11.31 | 11.31 | 11.31 |
| EBIT | 1,692.2 | 3,037.2 | 3,046.1 | 1,603.6 | 1,759.4 | 2,790.4 | 3,034.9 | 3,300.8 | 3,589.9 | 3,904.4 |
| EBIT, % | 6.39 | 9.96 | 9.02 | 5.41 | 4.89 | 7.13 | 7.13 | 7.13 | 7.13 | 7.13 |
| Total Cash | 2,239.7 | 5,431.3 | 6,775.3 | 9,630.6 | 11,692.0 | 8,707.8 | 9,470.7 | 10,300.4 | 11,202.7 | 12,184.1 |
| Total Cash, percent | .0 | .0 | .0 | .0 | .0 | .0 | .0 | .0 | .0 | .0 |
| Account Receivables | 4,060.5 | 4,376.4 | 3,809.0 | 4,223.2 | 5,970.4 | 5,617.6 | 6,109.7 | 6,644.9 | 7,227.1 | 7,860.2 |
| Account Receivables, % | 15.34 | 14.35 | 11.28 | 14.24 | 16.6 | 14.36 | 14.36 | 14.36 | 14.36 | 14.36 |
| Inventories | 2,946.0 | 3,192.7 | 3,151.7 | 3,195.5 | 3,792.4 | 4,087.5 | 4,445.5 | 4,835.0 | 5,258.6 | 5,719.2 |
| Inventories, % | 11.13 | 10.47 | 9.34 | 10.77 | 10.55 | 10.45 | 10.45 | 10.45 | 10.45 | 10.45 |
| Accounts Payable | 5,012.2 | 3,769.2 | 3,213.3 | 5,005.3 | 7,603.5 | 6,166.6 | 6,706.9 | 7,294.4 | 7,933.4 | 8,628.4 |
| Accounts Payable, % | 18.94 | 12.36 | 9.52 | 16.87 | 21.14 | 15.77 | 15.77 | 15.77 | 15.77 | 15.77 |
| Capital Expenditure | -3,330.4 | -4,358.2 | -3,924.2 | -3,128.3 | -4,590.8 | -4,834.9 | -5,258.5 | -5,719.1 | -6,220.1 | -6,765.1 |
| Capital Expenditure, % | -12.58 | -14.29 | -11.62 | -10.55 | -12.77 | -12.36 | -12.36 | -12.36 | -12.36 | -12.36 |
| Tax Rate, % | 2.39 | 2.39 | 2.39 | 2.39 | 2.39 | 2.39 | 2.39 | 2.39 | 2.39 | 2.39 |
| EBITAT | 1,542.1 | 2,834.2 | 2,990.3 | 1,549.3 | 1,717.4 | 2,661.2 | 2,894.4 | 3,147.9 | 3,423.7 | 3,723.7 |
| Depreciation | ||||||||||
| Changes in Account Receivables | ||||||||||
| Changes in Inventories | ||||||||||
| Changes in Accounts Payable | ||||||||||
| Capital Expenditure | ||||||||||
| UFCF | -426.8 | 220.2 | 2,782.9 | 3,199.8 | 887.7 | 869.8 | 2,135.9 | 2,323.1 | 2,526.6 | 2,747.9 |
| WACC, % | 6.48 | 6.49 | 6.52 | 6.51 | 6.51 | 6.5 | 6.5 | 6.5 | 6.5 | 6.5 |
| PV UFCF | ||||||||||
| SUM PV UFCF | 8,592.4 | |||||||||
| Long Term Growth Rate, % | 2.00 | |||||||||
| Free cash flow (T + 1) | 2,803 | |||||||||
| Terminal Value | 62,272 | |||||||||
| Present Terminal Value | 45,449 | |||||||||
| Enterprise Value | 54,041 | |||||||||
| Net Debt | -244 | |||||||||
| Equity Value | 54,285 | |||||||||
| Diluted Shares Outstanding, MM | 1,788 | |||||||||
| Equity Value Per Share | 30.35 |
What You Can Expect
- Adjustable Forecast Parameters: Effortlessly modify assumptions (growth %, margins, WACC) to generate various scenarios.
- Relevant Financial Insights: JCET Group Co., Ltd. (600584SS) financial data pre-entered to facilitate your analysis.
- Automatic DCF Calculations: The template computes Net Present Value (NPV) and intrinsic value for you.
- Customized and Professional Design: A sleek Excel model tailored to meet your valuation requirements.
- Designed for Analysts and Investors: Perfect for assessing projections, validating strategies, and enhancing efficiency.
Key Features
- Customizable Financial Projections: Adjust essential metrics such as revenue growth, EBITDA %, and capital investments.
- Instant DCF Valuation: Automatically determines intrinsic value, NPV, and other financial metrics in real-time.
- High-Level Accuracy: Incorporates JCET Group's real financial data for reliable valuation results.
- Streamlined Scenario Analysis: Effortlessly evaluate various assumptions and juxtapose results.
- Efficiency Booster: Avoid the complexities of creating intricate valuation models from the ground up.
How It Works
- Download: Obtain the pre-prepared Excel file containing JCET Group Co., Ltd.'s (600584SS) financial metrics.
- Customize: Modify your forecasts, including revenue growth, EBITDA %, and WACC tailored for JCET Group.
- Update Automatically: Watch as intrinsic value and NPV calculations refresh in real-time.
- Test Scenarios: Develop various projections and immediately compare the results.
- Make Decisions: Leverage the valuation insights to inform your investment choices regarding JCET Group.
Why Choose This Calculator for JCET Group Co., Ltd. (600584SS)?
- All-in-One Tool: Incorporates DCF, WACC, and financial ratio analysis for a complete evaluation.
- Flexible Inputs: Easily modify yellow-highlighted cells to explore different financial scenarios.
- In-Depth Analysis: Automatically computes the intrinsic value and Net Present Value for JCET Group.
- Preloaded Information: Features historical and projected data to provide a reliable foundation.
- Expert-Level Quality: Perfect for financial analysts, investors, and business consultants focusing on JCET Group.
Who Can Benefit from JCET Group Co., Ltd. (600584SS)?
- Individual Investors: Make educated decisions regarding the acquisition or sale of JCET Group (600584SS) shares.
- Financial Analysts: Enhance your valuation methodologies with comprehensive financial models tailored for JCET Group (600584SS).
- Consultants: Provide precise valuation assessments to clients efficiently, focusing on JCET Group (600584SS).
- Business Owners: Gain insights into how major firms like JCET Group (600584SS) are appraised to inform your strategic planning.
- Finance Students: Master valuation approaches using relevant data and case studies featuring JCET Group (600584SS).
Contents of the Template
- Pre-Filled Data: Contains JCET Group Co., Ltd.'s historical financial performance and projections.
- Discounted Cash Flow Model: An editable DCF valuation model featuring automated calculations.
- Weighted Average Cost of Capital (WACC): A dedicated worksheet for WACC calculations based on user-defined inputs.
- Key Financial Ratios: Evaluate JCET Group Co., Ltd.'s profitability, efficiency, and capital structure.
- Customizable Inputs: Easily adjust revenue growth rates, profit margins, and tax percentages.
- Clear Dashboard: Visualizations and tables that summarize essential valuation outcomes.
Disclaimer
All information, articles, and product details provided on this website are for general informational and educational purposes only. We do not claim any ownership over, nor do we intend to infringe upon, any trademarks, copyrights, logos, brand names, or other intellectual property mentioned or depicted on this site. Such intellectual property remains the property of its respective owners, and any references here are made solely for identification or informational purposes, without implying any affiliation, endorsement, or partnership.
We make no representations or warranties, express or implied, regarding the accuracy, completeness, or suitability of any content or products presented. Nothing on this website should be construed as legal, tax, investment, financial, medical, or other professional advice. In addition, no part of this site—including articles or product references—constitutes a solicitation, recommendation, endorsement, advertisement, or offer to buy or sell any securities, franchises, or other financial instruments, particularly in jurisdictions where such activity would be unlawful.
All content is of a general nature and may not address the specific circumstances of any individual or entity. It is not a substitute for professional advice or services. Any actions you take based on the information provided here are strictly at your own risk. You accept full responsibility for any decisions or outcomes arising from your use of this website and agree to release us from any liability in connection with your use of, or reliance upon, the content or products found herein.