
|
Shanghai Shibei Hi-Tech Co., Ltd. (600604.ss) Valoración de DCF |
Completamente Editable: Adáptelo A Sus Necesidades En Excel O Sheets
Diseño Profesional: Plantillas Confiables Y Estándares De La Industria
Predeterminadas Para Un Uso Rápido Y Eficiente
Compatible con MAC / PC, completamente desbloqueado
No Se Necesita Experiencia; Fáciles De Seguir
Shanghai Shibei Hi-Tech Co.,Ltd. (600604.SS) Bundle
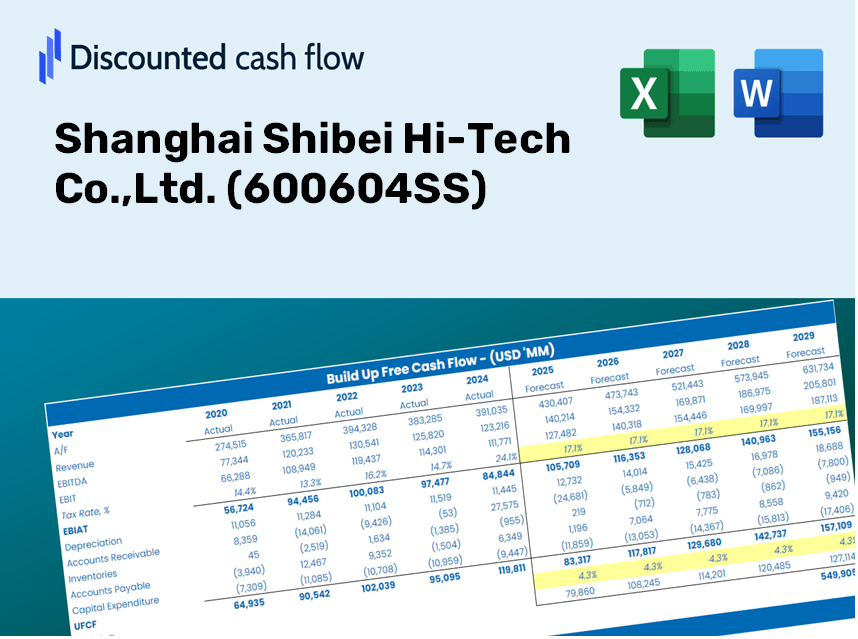
Como inversor o analista, la calculadora DCF (600604SS) es su recurso de referencia para una valoración precisa. Con datos reales de Shanghai Shibei Hi-Tech Co., Ltd. Prelabarrados, puede ajustar los pronósticos y observar los efectos en tiempo real.
Discounted Cash Flow (DCF) - (USD MM)
| Year | AY1 2020 |
AY2 2021 |
AY3 2022 |
AY4 2023 |
AY5 2024 |
FY1 2025 |
FY2 2026 |
FY3 2027 |
FY4 2028 |
FY5 2029 |
|---|---|---|---|---|---|---|---|---|---|---|
| Revenue | 1,202.3 | 1,114.1 | 1,263.0 | 1,021.8 | 2,581.5 | 3,142.5 | 3,825.4 | 4,656.7 | 5,668.7 | 6,900.5 |
| Revenue Growth, % | 0 | -7.34 | 13.36 | -19.1 | 152.66 | 21.73 | 21.73 | 21.73 | 21.73 | 21.73 |
| EBITDA | 647.2 | 642.1 | 669.5 | 433.9 | 775.2 | 1,489.3 | 1,813.0 | 2,206.9 | 2,686.5 | 3,270.3 |
| EBITDA, % | 53.83 | 57.63 | 53.01 | 42.46 | 30.03 | 47.39 | 47.39 | 47.39 | 47.39 | 47.39 |
| Depreciation | 187.7 | 246.0 | 296.2 | 321.5 | 327.2 | 661.7 | 805.5 | 980.6 | 1,193.7 | 1,453.1 |
| Depreciation, % | 15.61 | 22.08 | 23.46 | 31.47 | 12.67 | 21.06 | 21.06 | 21.06 | 21.06 | 21.06 |
| EBIT | 459.5 | 396.1 | 373.3 | 112.4 | 448.0 | 827.6 | 1,007.4 | 1,226.4 | 1,492.9 | 1,817.3 |
| EBIT, % | 38.22 | 35.55 | 29.56 | 11 | 17.35 | 26.34 | 26.34 | 26.34 | 26.34 | 26.34 |
| Total Cash | 825.9 | 1,478.8 | 2,133.6 | 1,505.0 | 1,054.4 | 2,573.9 | 3,133.3 | 3,814.2 | 4,643.0 | 5,652.0 |
| Total Cash, percent | .0 | .0 | .0 | .0 | .0 | .0 | .0 | .0 | .0 | .0 |
| Account Receivables | 124.1 | 245.9 | 207.6 | 107.3 | 258.0 | 435.8 | 530.5 | 645.8 | 786.1 | 956.9 |
| Account Receivables, % | 10.33 | 22.08 | 16.44 | 10.51 | 9.99 | 13.87 | 13.87 | 13.87 | 13.87 | 13.87 |
| Inventories | 9,950.1 | 8,786.8 | 8,769.4 | 9,120.9 | 6,649.4 | 3,142.5 | 3,825.4 | 4,656.7 | 5,668.7 | 6,900.5 |
| Inventories, % | 827.56 | 788.69 | 694.35 | 892.67 | 257.58 | 100 | 100 | 100 | 100 | 100 |
| Accounts Payable | 935.1 | 1,057.1 | 1,211.7 | 1,130.6 | 1,059.5 | 2,574.7 | 3,134.1 | 3,815.2 | 4,644.3 | 5,653.6 |
| Accounts Payable, % | 77.77 | 94.89 | 95.94 | 110.65 | 41.04 | 81.93 | 81.93 | 81.93 | 81.93 | 81.93 |
| Capital Expenditure | -9.0 | -22.4 | -52.6 | -33.6 | -.5 | -64.3 | -78.3 | -95.3 | -116.0 | -141.2 |
| Capital Expenditure, % | -0.74688 | -2.01 | -4.16 | -3.29 | -0.01945716 | -2.05 | -2.05 | -2.05 | -2.05 | -2.05 |
| Tax Rate, % | 79.87 | 79.87 | 79.87 | 79.87 | 79.87 | 79.87 | 79.87 | 79.87 | 79.87 | 79.87 |
| EBITAT | 339.5 | 218.5 | 191.0 | 156.8 | 90.2 | 497.1 | 605.2 | 736.7 | 896.8 | 1,091.6 |
| Depreciation | ||||||||||
| Changes in Account Receivables | ||||||||||
| Changes in Inventories | ||||||||||
| Changes in Accounts Payable | ||||||||||
| Capital Expenditure | ||||||||||
| UFCF | -8,620.9 | 1,605.6 | 645.0 | 112.3 | 2,666.7 | 5,938.7 | 1,114.3 | 1,356.4 | 1,651.2 | 2,010.0 |
| WACC, % | 5.1 | 4.81 | 4.75 | 5.51 | 4.26 | 4.89 | 4.89 | 4.89 | 4.89 | 4.89 |
| PV UFCF | ||||||||||
| SUM PV UFCF | 10,798.5 | |||||||||
| Long Term Growth Rate, % | 3.90 | |||||||||
| Free cash flow (T + 1) | 2,088 | |||||||||
| Terminal Value | 211,917 | |||||||||
| Present Terminal Value | 166,951 | |||||||||
| Enterprise Value | 177,749 | |||||||||
| Net Debt | 7,307 | |||||||||
| Equity Value | 170,443 | |||||||||
| Diluted Shares Outstanding, MM | 1,873 | |||||||||
| Equity Value Per Share | 90.98 |
What You Will Receive
- Authentic 600604SS Financial Data: Features both historical and projected figures for precise valuation.
- Customizable Inputs: Adjust WACC, tax rates, revenue growth, and capital expenditures as needed.
- Dynamic Calculations: Automatically calculates intrinsic value and NPV in real-time.
- Scenario Testing: Analyze various scenarios to assess the future outlook of Shanghai Shibei Hi-Tech Co., Ltd.
- User-Friendly Design: Designed for industry professionals, yet simple enough for newcomers.
Key Features
- Accurate Financial Data: Gain access to reliable pre-loaded historical figures and forecasts for Shanghai Shibei Hi-Tech Co., Ltd. (600604SS).
- Customizable Economic Assumptions: Modify highlighted parameters such as WACC, growth rates, and profit margins as needed.
- Real-Time Calculations: Enjoy automatic updates for DCF, Net Present Value (NPV), and cash flow assessments.
- User-Friendly Dashboard: Clear charts and summaries to help you visualize your valuation outcomes effortlessly.
- Designed for All Skill Levels: An intuitive layout tailored for investors, CFOs, and consultants alike.
How It Works
- Step 1: Download the Excel file.
- Step 2: Review Shanghai Shibei Hi-Tech Co., Ltd.'s pre-filled financial data and forecasts.
- Step 3: Adjust key inputs such as revenue growth, WACC, and tax rates (highlighted cells).
- Step 4: Observe the DCF model update in real-time as you modify your assumptions.
- Step 5: Examine the outputs and leverage the results for your investment decisions.
Why Opt for This Calculator?
- Precise Data: Authentic Shanghai Shibei Hi-Tech Co., Ltd. financials guarantee trustworthy valuation outcomes.
- Tailorable: Modify essential variables such as growth rates, WACC, and tax rates to align with your forecasts.
- Efficiency Boost: Pre-configured calculations save you the hassle of starting from square one.
- Industry-Standard Tool: Crafted for investors, analysts, and consultants in the field.
- Accessible: A user-friendly design and detailed instructions facilitate ease of use for everyone.
Who Can Benefit from This Product?
- Finance Students: Master valuation methodologies and practice with authentic data from Shanghai Shibei Hi-Tech Co., Ltd. (600604SS).
- Academics: Integrate advanced financial models into your studies or research initiatives.
- Investors: Challenge your own assumptions and evaluate valuation scenarios for Shanghai Shibei Hi-Tech Co., Ltd. (600604SS).
- Analysts: Enhance your productivity with a customizable and ready-to-use DCF model.
- Small Business Owners: Discover the analytical approaches used for large public companies like Shanghai Shibei Hi-Tech Co., Ltd. (600604SS).
Contents of the Template
- Pre-Filled Data: Contains Shanghai Shibei Hi-Tech Co., Ltd.'s historical financials and projections.
- Discounted Cash Flow Model: An editable DCF valuation model with automatic computations.
- Weighted Average Cost of Capital (WACC): A designated sheet for WACC calculations based on user-defined inputs.
- Key Financial Ratios: Evaluate Shanghai Shibei Hi-Tech’s profitability, efficiency, and leverage metrics.
- Customizable Inputs: Easily modify revenue growth, profit margins, and tax rates.
- Clear Dashboard: Visual representations and tables summarizing essential valuation outcomes.
Disclaimer
All information, articles, and product details provided on this website are for general informational and educational purposes only. We do not claim any ownership over, nor do we intend to infringe upon, any trademarks, copyrights, logos, brand names, or other intellectual property mentioned or depicted on this site. Such intellectual property remains the property of its respective owners, and any references here are made solely for identification or informational purposes, without implying any affiliation, endorsement, or partnership.
We make no representations or warranties, express or implied, regarding the accuracy, completeness, or suitability of any content or products presented. Nothing on this website should be construed as legal, tax, investment, financial, medical, or other professional advice. In addition, no part of this site—including articles or product references—constitutes a solicitation, recommendation, endorsement, advertisement, or offer to buy or sell any securities, franchises, or other financial instruments, particularly in jurisdictions where such activity would be unlawful.
All content is of a general nature and may not address the specific circumstances of any individual or entity. It is not a substitute for professional advice or services. Any actions you take based on the information provided here are strictly at your own risk. You accept full responsibility for any decisions or outcomes arising from your use of this website and agree to release us from any liability in connection with your use of, or reliance upon, the content or products found herein.