
|
Groenland Holdings Corporation Limited (600606.SS) Valoración de DCF |
Completamente Editable: Adáptelo A Sus Necesidades En Excel O Sheets
Diseño Profesional: Plantillas Confiables Y Estándares De La Industria
Predeterminadas Para Un Uso Rápido Y Eficiente
Compatible con MAC / PC, completamente desbloqueado
No Se Necesita Experiencia; Fáciles De Seguir
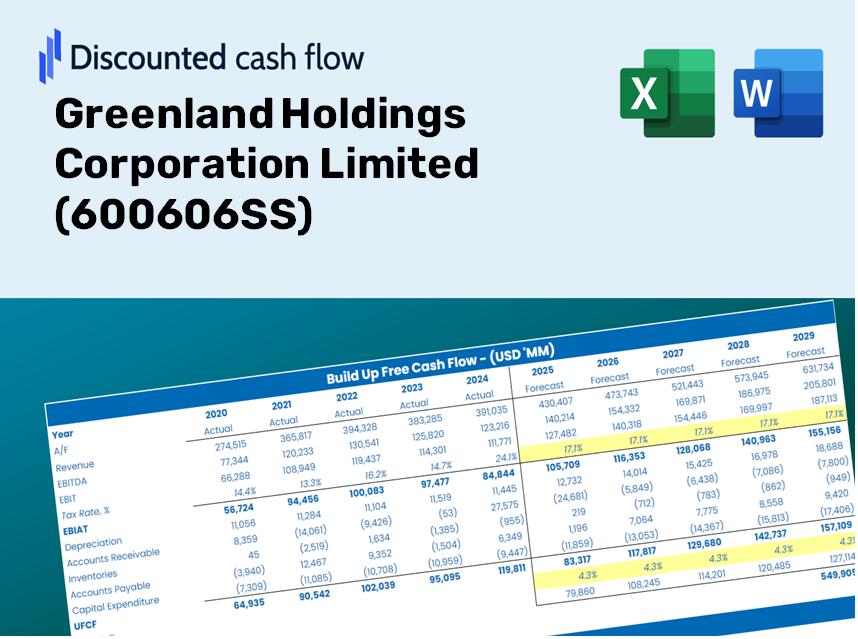
Greenland Holdings Corporation Limited (600606.SS) Bundle
¡Explore las perspectivas financieras de Groenland Holdings Corporation Limited (600606SS) con nuestra calculadora DCF fácil de usar! Ingrese sus suposiciones con respecto al crecimiento, los márgenes y los gastos para determinar el valor intrínseco de Groenland Holdings Corporation Limited (600606SS) y refinar su enfoque de inversión.
Discounted Cash Flow (DCF) - (USD MM)
| Year | AY1 2020 |
AY2 2021 |
AY3 2022 |
AY4 2023 |
AY5 2024 |
FY1 2025 |
FY2 2026 |
FY3 2027 |
FY4 2028 |
FY5 2029 |
|---|---|---|---|---|---|---|---|---|---|---|
| Revenue | 456,062.0 | 544,755.8 | 435,908.7 | 360,312.2 | 240,908.1 | 210,183.6 | 183,377.5 | 159,990.3 | 139,585.7 | 121,783.5 |
| Revenue Growth, % | 0 | 19.45 | -19.98 | -17.34 | -33.14 | -12.75 | -12.75 | -12.75 | -12.75 | -12.75 |
| EBITDA | 32,262.1 | 25,188.2 | 17,962.6 | 5,935.0 | 685.4 | 7,461.6 | 6,510.0 | 5,679.7 | 4,955.4 | 4,323.4 |
| EBITDA, % | 7.07 | 4.62 | 4.12 | 1.65 | 0.28449 | 3.55 | 3.55 | 3.55 | 3.55 | 3.55 |
| Depreciation | 2,730.3 | 3,263.8 | 3,443.1 | 2,964.2 | 2,683.3 | 1,649.6 | 1,439.2 | 1,255.7 | 1,095.5 | 955.8 |
| Depreciation, % | 0.59867 | 0.59913 | 0.78986 | 0.82267 | 1.11 | 0.78484 | 0.78484 | 0.78484 | 0.78484 | 0.78484 |
| EBIT | 29,531.8 | 21,924.3 | 14,519.5 | 2,970.8 | -1,998.0 | 5,812.0 | 5,070.8 | 4,424.1 | 3,859.8 | 3,367.6 |
| EBIT, % | 6.48 | 4.02 | 3.33 | 0.82452 | -0.82936 | 2.77 | 2.77 | 2.77 | 2.77 | 2.77 |
| Total Cash | 116,409.5 | 93,841.8 | 71,175.0 | 56,083.0 | 33,288.6 | 37,186.7 | 32,444.0 | 28,306.2 | 24,696.2 | 21,546.5 |
| Total Cash, percent | .0 | .0 | .0 | .0 | .0 | .0 | .0 | .0 | .0 | .0 |
| Account Receivables | 323,661.7 | 267,448.3 | 283,291.1 | 256,842.1 | 333,508.6 | 149,791.8 | 130,687.9 | 114,020.5 | 99,478.7 | 86,791.6 |
| Account Receivables, % | 70.97 | 49.1 | 64.99 | 71.28 | 138.44 | 71.27 | 71.27 | 71.27 | 71.27 | 71.27 |
| Inventories | 723,969.8 | 773,151.0 | 683,274.3 | 567,898.2 | 502,551.5 | 210,183.6 | 183,377.5 | 159,990.3 | 139,585.7 | 121,783.5 |
| Inventories, % | 158.74 | 141.93 | 156.75 | 157.61 | 208.61 | 100 | 100 | 100 | 100 | 100 |
| Accounts Payable | 328,294.6 | 415,793.8 | 435,235.3 | 394,617.7 | 351,848.2 | 188,390.4 | 164,363.8 | 143,401.5 | 125,112.6 | 109,156.2 |
| Accounts Payable, % | 71.98 | 76.33 | 99.85 | 109.52 | 146.05 | 89.63 | 89.63 | 89.63 | 89.63 | 89.63 |
| Capital Expenditure | -9,001.2 | -6,805.6 | -2,770.6 | -404.4 | -486.3 | -1,754.0 | -1,530.3 | -1,335.2 | -1,164.9 | -1,016.3 |
| Capital Expenditure, % | -1.97 | -1.25 | -0.63558 | -0.11224 | -0.20187 | -0.83453 | -0.83453 | -0.83453 | -0.83453 | -0.83453 |
| Tax Rate, % | 2.12 | 2.12 | 2.12 | 2.12 | 2.12 | 2.12 | 2.12 | 2.12 | 2.12 | 2.12 |
| EBITAT | 14,431.9 | 7,554.3 | 1,697.0 | 4,606.6 | -1,955.5 | 3,404.5 | 2,970.3 | 2,591.5 | 2,261.0 | 1,972.6 |
| Depreciation | ||||||||||
| Changes in Account Receivables | ||||||||||
| Changes in Inventories | ||||||||||
| Changes in Accounts Payable | ||||||||||
| Capital Expenditure | ||||||||||
| UFCF | -711,175.8 | 98,543.9 | 95,845.0 | 108,373.7 | -53,847.8 | 315,927.0 | 24,762.5 | 21,604.4 | 18,849.1 | 16,445.1 |
| WACC, % | 2.6 | 2.16 | 1.47 | 4.16 | 4.1 | 2.9 | 2.9 | 2.9 | 2.9 | 2.9 |
| PV UFCF | ||||||||||
| SUM PV UFCF | 381,316.0 | |||||||||
| Long Term Growth Rate, % | 2.00 | |||||||||
| Free cash flow (T + 1) | 16,774 | |||||||||
| Terminal Value | 1,867,763 | |||||||||
| Present Terminal Value | 1,619,144 | |||||||||
| Enterprise Value | 2,000,460 | |||||||||
| Net Debt | 112,552 | |||||||||
| Equity Value | 1,887,908 | |||||||||
| Diluted Shares Outstanding, MM | 14,011 | |||||||||
| Equity Value Per Share | 134.75 |
What You Will Receive
- Authentic 600606SS Financial Data: Includes Greenland Holdings Corporation Limited’s historical and projected figures for thorough analysis.
- Completely Customizable Template: Easily adjust essential inputs such as revenue growth, WACC, and EBITDA percentage.
- Instant Calculations: Watch the intrinsic value of Greenland Holdings update in real time as you make changes.
- Advanced Valuation Tool: Tailored for investors, analysts, and consultants aiming for precise DCF results.
- User-Friendly Interface: Designed with a straightforward layout and clear instructions suitable for all skill levels.
Key Features
- Real-Time Greenland Holdings Data: Equipped with Greenland Holdings Corporation Limited’s historical financial metrics and future projections.
- Customizable Parameters: Modify revenue growth, profit margins, WACC, tax rates, and capital expenditures as needed.
- Interactive Valuation Model: Automatically calculates Net Present Value (NPV) and intrinsic value based on your input adjustments.
- Scenario Analysis: Generate various forecasting scenarios to evaluate different valuation results.
- User-Friendly Interface: Intuitive layout designed for both seasoned professionals and newcomers.
How It Functions
- 1. Access the Template: Download and open the Excel file featuring Greenland Holdings Corporation Limited’s (600606SS) preloaded data.
- 2. Adjust Assumptions: Modify essential inputs such as growth rates, WACC, and capital expenditures.
- 3. Observe Results Immediately: The DCF model automatically computes the intrinsic value and NPV.
- 4. Evaluate Scenarios: Analyze various forecasts to explore different valuation results.
- 5. Utilize with Assurance: Present expert valuation insights to back your business decisions.
Why Use This Calculator for Greenland Holdings Corporation Limited (600606SS)?
- Reliable Data: Accurate financials for Greenland Holdings provide dependable valuation insights.
- Fully Customizable: Modify essential variables such as growth rates, WACC, and tax rates to fit your forecasts.
- Efficient: Pre-configured calculations save you the hassle of starting from scratch.
- Professional-Quality Tool: Tailored for investors, analysts, and consultants in the industry.
- Easy to Use: A user-friendly design and clear instructions ensure accessibility for everyone.
Who Can Benefit from This Product?
- Investors: Make informed choices with a top-tier valuation tool tailored for professionals.
- Financial Analysts: Streamline your workflow with a ready-to-customize DCF model.
- Consultants: Effortlessly modify the template for client reports or presentations.
- Finance Enthusiasts: Enhance your grasp of valuation methods through practical, real-life examples.
- Educators and Students: Utilize it as a hands-on resource in finance coursework.
What the Template Includes
- Comprehensive DCF Model: Editable template featuring detailed valuation calculations.
- Real-World Data: Greenland Holdings Corporation Limited’s (600606SS) historical and projected financials preloaded for analysis.
- Customizable Parameters: Modify WACC, growth rates, and tax assumptions to explore various scenarios.
- Financial Statements: Complete annual and quarterly breakdowns for in-depth insights.
- Key Ratios: Integrated analysis for profitability, efficiency, and leverage ratios.
- Dashboard with Visual Outputs: Charts and tables presenting clear, actionable results.
Disclaimer
All information, articles, and product details provided on this website are for general informational and educational purposes only. We do not claim any ownership over, nor do we intend to infringe upon, any trademarks, copyrights, logos, brand names, or other intellectual property mentioned or depicted on this site. Such intellectual property remains the property of its respective owners, and any references here are made solely for identification or informational purposes, without implying any affiliation, endorsement, or partnership.
We make no representations or warranties, express or implied, regarding the accuracy, completeness, or suitability of any content or products presented. Nothing on this website should be construed as legal, tax, investment, financial, medical, or other professional advice. In addition, no part of this site—including articles or product references—constitutes a solicitation, recommendation, endorsement, advertisement, or offer to buy or sell any securities, franchises, or other financial instruments, particularly in jurisdictions where such activity would be unlawful.
All content is of a general nature and may not address the specific circumstances of any individual or entity. It is not a substitute for professional advice or services. Any actions you take based on the information provided here are strictly at your own risk. You accept full responsibility for any decisions or outcomes arising from your use of this website and agree to release us from any liability in connection with your use of, or reliance upon, the content or products found herein.