
|
Shenyang Jinbei Automotive Company Limited (600609.SS) DCF Valoración |
Completamente Editable: Adáptelo A Sus Necesidades En Excel O Sheets
Diseño Profesional: Plantillas Confiables Y Estándares De La Industria
Predeterminadas Para Un Uso Rápido Y Eficiente
Compatible con MAC / PC, completamente desbloqueado
No Se Necesita Experiencia; Fáciles De Seguir
Shenyang Jinbei Automotive Company Limited (600609.SS) Bundle
¿Busca evaluar el valor intrínseco de Shenyang Jinbei Automotive Company Limited? Nuestra calculadora DCF (600609SS) integra datos del mundo real con extensas funciones de personalización, lo que le permite refinar sus pronósticos y mejorar sus estrategias de inversión.
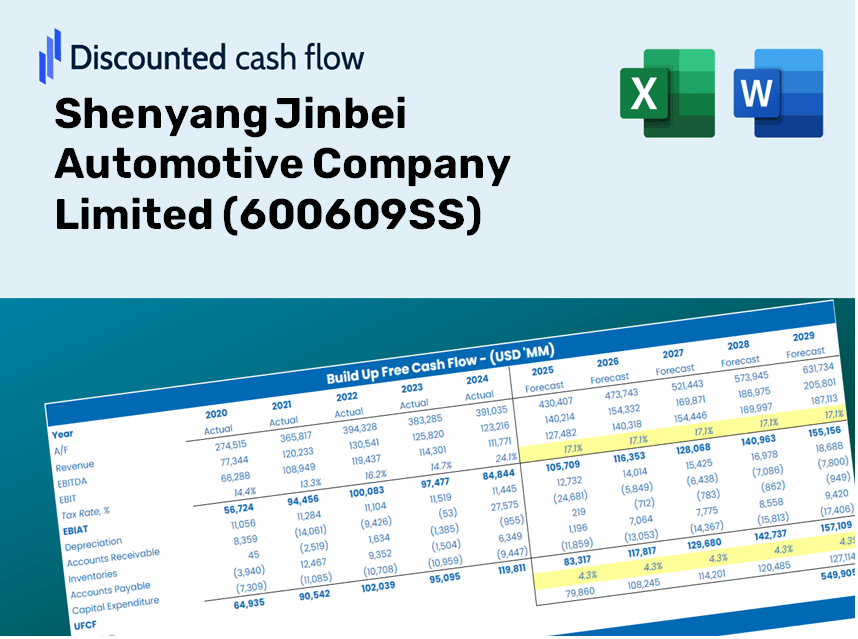
Discounted Cash Flow (DCF) - (USD MM)
| Year | AY1 2020 |
AY2 2021 |
AY3 2022 |
AY4 2023 |
AY5 2024 |
FY1 2025 |
FY2 2026 |
FY3 2027 |
FY4 2028 |
FY5 2029 |
|---|---|---|---|---|---|---|---|---|---|---|
| Revenue | 5,457.0 | 5,190.8 | 5,631.2 | 5,139.6 | 4,366.2 | 4,146.0 | 3,936.9 | 3,738.4 | 3,549.8 | 3,370.8 |
| Revenue Growth, % | 0 | -4.88 | 8.49 | -8.73 | -15.05 | -5.04 | -5.04 | -5.04 | -5.04 | -5.04 |
| EBITDA | 383.4 | 565.5 | 528.4 | 480.1 | 712.1 | 439.1 | 417.0 | 395.9 | 376.0 | 357.0 |
| EBITDA, % | 7.03 | 10.89 | 9.38 | 9.34 | 16.31 | 10.59 | 10.59 | 10.59 | 10.59 | 10.59 |
| Depreciation | 106.2 | 111.9 | 118.3 | 126.5 | 126.4 | 95.8 | 91.0 | 86.4 | 82.1 | 77.9 |
| Depreciation, % | 1.95 | 2.16 | 2.1 | 2.46 | 2.9 | 2.31 | 2.31 | 2.31 | 2.31 | 2.31 |
| EBIT | 277.2 | 453.6 | 410.1 | 353.6 | 585.7 | 343.3 | 325.9 | 309.5 | 293.9 | 279.1 |
| EBIT, % | 5.08 | 8.74 | 7.28 | 6.88 | 13.42 | 8.28 | 8.28 | 8.28 | 8.28 | 8.28 |
| Total Cash | 1,824.8 | 1,539.6 | 1,331.8 | 1,654.9 | 1,482.5 | 1,267.9 | 1,203.9 | 1,143.2 | 1,085.6 | 1,030.8 |
| Total Cash, percent | .0 | .0 | .0 | .0 | .0 | .0 | .0 | .0 | .0 | .0 |
| Account Receivables | 1,210.8 | 907.7 | 1,030.7 | 557.1 | 270.3 | 622.0 | 590.6 | 560.8 | 532.5 | 505.7 |
| Account Receivables, % | 22.19 | 17.49 | 18.3 | 10.84 | 6.19 | 15 | 15 | 15 | 15 | 15 |
| Inventories | 300.1 | 280.7 | 365.6 | 247.5 | 232.6 | 228.4 | 216.9 | 205.9 | 195.5 | 185.7 |
| Inventories, % | 5.5 | 5.41 | 6.49 | 4.82 | 5.33 | 5.51 | 5.51 | 5.51 | 5.51 | 5.51 |
| Accounts Payable | 1,472.7 | 1,203.4 | 687.4 | 1,252.9 | 991.2 | 907.6 | 861.8 | 818.4 | 777.1 | 737.9 |
| Accounts Payable, % | 26.99 | 23.18 | 12.21 | 24.38 | 22.7 | 21.89 | 21.89 | 21.89 | 21.89 | 21.89 |
| Capital Expenditure | -116.0 | -128.4 | -186.5 | -67.4 | -124.0 | -100.0 | -95.0 | -90.2 | -85.6 | -81.3 |
| Capital Expenditure, % | -2.12 | -2.47 | -3.31 | -1.31 | -2.84 | -2.41 | -2.41 | -2.41 | -2.41 | -2.41 |
| Tax Rate, % | 32.78 | 32.78 | 32.78 | 32.78 | 32.78 | 32.78 | 32.78 | 32.78 | 32.78 | 32.78 |
| EBITAT | 571.8 | 228.0 | 150.8 | 175.9 | 393.7 | 208.7 | 198.2 | 188.2 | 178.7 | 169.7 |
| Depreciation | ||||||||||
| Changes in Account Receivables | ||||||||||
| Changes in Inventories | ||||||||||
| Changes in Accounts Payable | ||||||||||
| Capital Expenditure | ||||||||||
| UFCF | 523.7 | 264.8 | -641.4 | 1,392.4 | 436.0 | -226.4 | 191.3 | 181.7 | 172.5 | 163.8 |
| WACC, % | 4.94 | 4.79 | 4.75 | 4.79 | 4.84 | 4.82 | 4.82 | 4.82 | 4.82 | 4.82 |
| PV UFCF | ||||||||||
| SUM PV UFCF | 388.2 | |||||||||
| Long Term Growth Rate, % | 2.00 | |||||||||
| Free cash flow (T + 1) | 167 | |||||||||
| Terminal Value | 5,917 | |||||||||
| Present Terminal Value | 4,675 | |||||||||
| Enterprise Value | 5,063 | |||||||||
| Net Debt | -1,478 | |||||||||
| Equity Value | 6,541 | |||||||||
| Diluted Shares Outstanding, MM | 1,305 | |||||||||
| Equity Value Per Share | 5.01 |
What You Will Receive
- Adjustable Forecast Parameters: Effortlessly modify key assumptions (growth %, profit margins, WACC) to generate various scenarios.
- Real-World Insights: Shenyang Jinbei Automotive Company Limited’s (600609SS) financial data preloaded to facilitate your analysis.
- Automated DCF Results: The template computes Net Present Value (NPV) and intrinsic value automatically.
- Tailored and Professional: A refined Excel model designed to meet your valuation requirements.
- Designed for Analysts and Investors: Perfect for testing forecasts, validating strategies, and enhancing efficiency.
Key Features
- Customizable Forecast Inputs: Adjust essential metrics such as revenue growth rates, EBITDA percentages, and capital expenditures.
- Instant DCF Valuation: Quickly calculates intrinsic value, NPV, and additional financial outputs.
- High-Precision Accuracy: Employs Shenyang Jinbei Automotive's (600609SS) actual financial data for realistic valuation results.
- Effortless Scenario Analysis: Easily evaluate different assumptions and analyze outcomes side by side.
- Efficiency Booster: Avoid the complexity of creating elaborate valuation models from the ground up.
How It Functions
- 1. Access the Template: Download and open the Excel file featuring Shenyang Jinbei Automotive Company Limited’s preconfigured data.
- 2. Adjust Assumptions: Modify essential inputs such as growth rates, WACC, and capital expenditures.
- 3. View Instant Results: The DCF model automatically computes intrinsic value and NPV in real-time.
- 4. Experiment with Scenarios: Evaluate various forecasts to assess different valuation possibilities.
- 5. Utilize with Assurance: Provide professional valuation insights to enhance your decision-making process.
Why Opt for This Calculator?
- Designed for Industry Experts: A sophisticated tool tailored for analysts, CFOs, and consultants.
- Accurate Data Integration: Shenyang Jinbei Automotive Company Limited’s (600609SS) historical and future financials are preloaded for reliability.
- Flexibility in Analysis: Effortlessly simulate various forecasts and assumptions.
- Comprehensive Outputs: Automatically computes intrinsic value, NPV, and essential metrics.
- User-Friendly Interface: Step-by-step instructions facilitate an intuitive experience.
Who Can Benefit from This Product?
- Investors: Effectively assess the fair value of Shenyang Jinbei Automotive Company Limited (600609SS) prior to making investment choices.
- CFOs: Utilize a high-quality DCF model for comprehensive financial reporting and analysis.
- Consultants: Seamlessly customize the template for valuation reports tailored to clients.
- Entrepreneurs: Acquire knowledge about financial modeling practices utilized by leading automotive firms.
- Educators: Employ it as an instructional resource to illustrate valuation techniques.
Contents of the Template
- Preloaded 600609SS Data: Historical and projected financial information, including revenue, EBIT, and capital expenditures.
- DCF and WACC Models: Advanced spreadsheets for calculating intrinsic value and Weighted Average Cost of Capital.
- Editable Inputs: Cells highlighted in yellow for modifying revenue growth, tax rates, and discount rates.
- Financial Statements: Detailed annual and quarterly financials for in-depth analysis.
- Key Ratios: Ratios for profitability, leverage, and efficiency to assess performance.
- Dashboard and Charts: Visual representations of valuation outcomes and underlying assumptions.
Disclaimer
All information, articles, and product details provided on this website are for general informational and educational purposes only. We do not claim any ownership over, nor do we intend to infringe upon, any trademarks, copyrights, logos, brand names, or other intellectual property mentioned or depicted on this site. Such intellectual property remains the property of its respective owners, and any references here are made solely for identification or informational purposes, without implying any affiliation, endorsement, or partnership.
We make no representations or warranties, express or implied, regarding the accuracy, completeness, or suitability of any content or products presented. Nothing on this website should be construed as legal, tax, investment, financial, medical, or other professional advice. In addition, no part of this site—including articles or product references—constitutes a solicitation, recommendation, endorsement, advertisement, or offer to buy or sell any securities, franchises, or other financial instruments, particularly in jurisdictions where such activity would be unlawful.
All content is of a general nature and may not address the specific circumstances of any individual or entity. It is not a substitute for professional advice or services. Any actions you take based on the information provided here are strictly at your own risk. You accept full responsibility for any decisions or outcomes arising from your use of this website and agree to release us from any liability in connection with your use of, or reliance upon, the content or products found herein.