
|
Shanghai Oriental Pearl Group Co., Ltd. (600637.SS) Valoración de DCF |
Completamente Editable: Adáptelo A Sus Necesidades En Excel O Sheets
Diseño Profesional: Plantillas Confiables Y Estándares De La Industria
Predeterminadas Para Un Uso Rápido Y Eficiente
Compatible con MAC / PC, completamente desbloqueado
No Se Necesita Experiencia; Fáciles De Seguir
Shanghai Oriental Pearl Group Co., Ltd. (600637.SS) Bundle
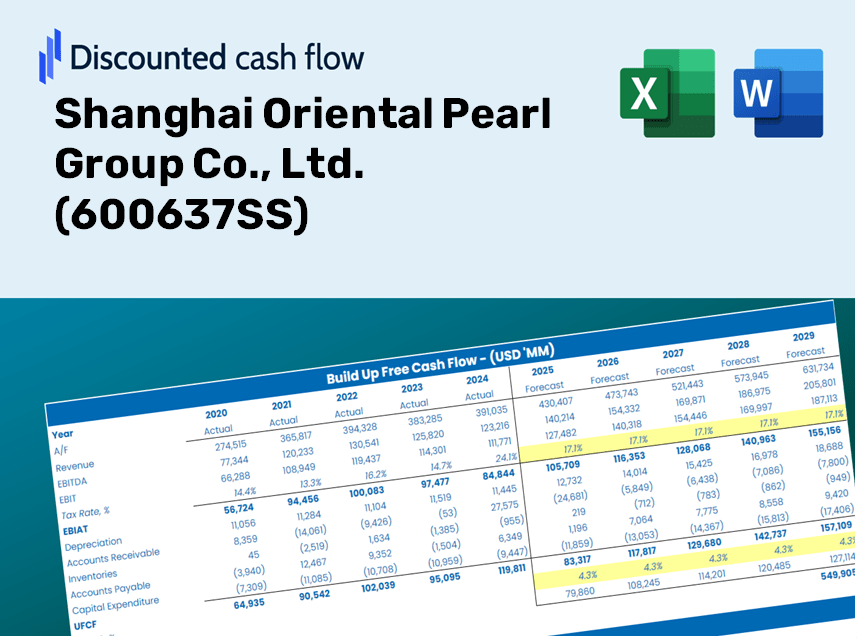
¡Masper el análisis de valoración de Shanghai Oriental Pearl Group Co., Ltd. (600637SS) con nuestra calculadora DCF de vanguardia! Esta plantilla de Excel viene previamente con datos reales (600637SS), lo que le permite ajustar los pronósticos y supuestos para un cálculo preciso de Shanghai Oriental Pearl Group Co., Ltd. Valor intrínseco.
Benefits You Will Receive
- Authentic 600637SS Financials: Access to both historical and projected data for precise evaluation.
- Customizable Inputs: Adjust WACC, tax rates, revenue growth, and capital expenditures according to your needs.
- Real-Time Calculations: Intrinsic value and NPV are computed automatically.
- Scenario Testing: Explore various scenarios to assess the future performance of Shanghai Oriental Pearl Group.
- User-Friendly Design: Designed for industry professionals while remaining approachable for newcomers.
Key Features
- Comprehensive DCF Calculator: Provides detailed unlevered and levered DCF valuation models tailored for Shanghai Oriental Pearl Group Co., Ltd. (600637SS).
- WACC Calculator: Features a pre-built Weighted Average Cost of Capital worksheet with customizable inputs specific to (600637SS).
- Customizable Forecast Assumptions: Adjust growth rates, capital expenditures, and discount rates as per the needs of (600637SS).
- Integrated Financial Ratios: Evaluate profitability, leverage, and efficiency ratios relevant to Shanghai Oriental Pearl Group Co., Ltd. (600637SS).
- Interactive Dashboard and Charts: Visual representations that summarize key valuation metrics for straightforward analysis of (600637SS).
How It Operates
- Download: Obtain the pre-built Excel file containing financial data for Shanghai Oriental Pearl Group Co., Ltd. (600637SS).
- Customize: Modify projections, including revenue growth rates, EBITDA percentages, and WACC.
- Update Automatically: Watch as intrinsic value and NPV calculations refresh in real-time.
- Test Scenarios: Develop various projections and instantly compare different outcomes.
- Make Decisions: Utilize the valuation findings to inform your investment strategy.
Why Choose Shanghai Oriental Pearl Group (600637SS) Calculator?
- Precision: Utilizes accurate financial data from Shanghai Oriental Pearl Group for reliable results.
- Adaptability: Built to allow users to easily adjust and experiment with various inputs.
- Efficiency: Eliminate the complexities of creating a DCF model from the ground up.
- Expert-Level: Crafted with the expertise and insight expected at the CFO level.
- Intuitive Design: Simple interface makes it accessible for users of all financial backgrounds.
Who Can Benefit from This Product?
- Professional Investors: Develop comprehensive and trustworthy valuation models for analyzing portfolios related to Shanghai Oriental Pearl Group Co., Ltd. (600637SS).
- Corporate Finance Teams: Evaluate various valuation scenarios to inform and shape internal strategies for the company.
- Consultants and Advisors: Deliver precise valuation insights for clients interested in Shanghai Oriental Pearl Group Co., Ltd. (600637SS).
- Students and Educators: Utilize real-world data to enhance financial modeling skills and educational experiences.
- Entertainment Industry Enthusiasts: Gain insights into how entertainment companies like Shanghai Oriental Pearl Group Co., Ltd. (600637SS) are assessed in the market.
Contents of the Template
- Pre-Filled Data: Features Shanghai Oriental Pearl Group's historical financial performance and projections.
- Discounted Cash Flow Model: An editable DCF valuation model with automatic calculation capabilities.
- Weighted Average Cost of Capital (WACC): A dedicated worksheet to compute WACC using customized inputs.
- Key Financial Ratios: Evaluate Shanghai Oriental Pearl Group's profitability, efficiency, and capital structure.
- Customizable Inputs: Easily adjust revenue growth, profit margins, and tax rates.
- Clear Dashboard: Visualizations and tables that summarize essential valuation outcomes.
Disclaimer
All information, articles, and product details provided on this website are for general informational and educational purposes only. We do not claim any ownership over, nor do we intend to infringe upon, any trademarks, copyrights, logos, brand names, or other intellectual property mentioned or depicted on this site. Such intellectual property remains the property of its respective owners, and any references here are made solely for identification or informational purposes, without implying any affiliation, endorsement, or partnership.
We make no representations or warranties, express or implied, regarding the accuracy, completeness, or suitability of any content or products presented. Nothing on this website should be construed as legal, tax, investment, financial, medical, or other professional advice. In addition, no part of this site—including articles or product references—constitutes a solicitation, recommendation, endorsement, advertisement, or offer to buy or sell any securities, franchises, or other financial instruments, particularly in jurisdictions where such activity would be unlawful.
All content is of a general nature and may not address the specific circumstances of any individual or entity. It is not a substitute for professional advice or services. Any actions you take based on the information provided here are strictly at your own risk. You accept full responsibility for any decisions or outcomes arising from your use of this website and agree to release us from any liability in connection with your use of, or reliance upon, the content or products found herein.