
|
Shanghai Lujiazui Finanzas & Trade Zone Development Co., Ltd. (600663.SS) Valoración de DCF |
Completamente Editable: Adáptelo A Sus Necesidades En Excel O Sheets
Diseño Profesional: Plantillas Confiables Y Estándares De La Industria
Predeterminadas Para Un Uso Rápido Y Eficiente
Compatible con MAC / PC, completamente desbloqueado
No Se Necesita Experiencia; Fáciles De Seguir
Shanghai Lujiazui Finance & Trade Zone Development Co., Ltd. (600663.SS) Bundle
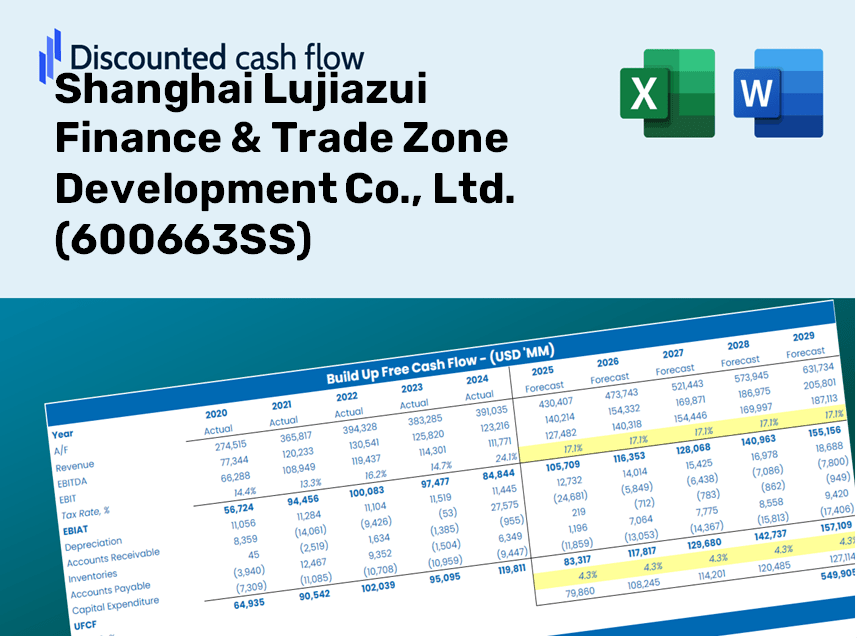
Explore el potencial financiero de las finanzas de Shanghai Lujiazui & Trade Zone Development Co., Ltd. (600663SS) con nuestra calculadora DCF fácil de usar. Ingrese sus proyecciones para el crecimiento, los márgenes y los costos para calcular el valor intrínseco de la financiación de Shanghai Lujiazui & Trade Zone Development Co., Ltd. (600663SS) y mejora su enfoque de inversión.
Discounted Cash Flow (DCF) - (USD MM)
| Year | AY1 2020 |
AY2 2021 |
AY3 2022 |
AY4 2023 |
AY5 2024 |
FY1 2025 |
FY2 2026 |
FY3 2027 |
FY4 2028 |
FY5 2029 |
|---|---|---|---|---|---|---|---|---|---|---|
| Revenue | 14,474.7 | 13,872.0 | 11,754.7 | 11,005.9 | 14,651.0 | 17,344.3 | 20,532.6 | 24,307.1 | 28,775.5 | 34,065.2 |
| Revenue Growth, % | 0 | -4.16 | -15.26 | -6.37 | 33.12 | 18.38 | 18.38 | 18.38 | 18.38 | 18.38 |
| EBITDA | 7,571.4 | 7,285.6 | 4,516.3 | 5,318.1 | 4,808.5 | 7,783.7 | 9,214.6 | 10,908.5 | 12,913.8 | 15,287.8 |
| EBITDA, % | 52.31 | 52.52 | 38.42 | 48.32 | 32.82 | 44.88 | 44.88 | 44.88 | 44.88 | 44.88 |
| Depreciation | 86.4 | 85.0 | 974.8 | 1,023.7 | 1,005.3 | 890.3 | 1,053.9 | 1,247.7 | 1,477.0 | 1,748.6 |
| Depreciation, % | 0.59689 | 0.61263 | 8.29 | 9.3 | 6.86 | 5.13 | 5.13 | 5.13 | 5.13 | 5.13 |
| EBIT | 7,485.0 | 7,200.6 | 3,541.5 | 4,294.4 | 3,803.2 | 6,893.5 | 8,160.7 | 9,660.9 | 11,436.8 | 13,539.2 |
| EBIT, % | 51.71 | 51.91 | 30.13 | 39.02 | 25.96 | 39.74 | 39.74 | 39.74 | 39.74 | 39.74 |
| Total Cash | 7,666.3 | 17,665.4 | 12,743.1 | 13,944.5 | 11,979.1 | 15,080.0 | 17,852.2 | 21,133.9 | 25,018.9 | 29,618.1 |
| Total Cash, percent | .0 | .0 | .0 | .0 | .0 | .0 | .0 | .0 | .0 | .0 |
| Account Receivables | 809.7 | 1,451.4 | 883.3 | 1,572.9 | 1,145.1 | 1,584.5 | 1,875.8 | 2,220.6 | 2,628.8 | 3,112.1 |
| Account Receivables, % | 5.59 | 10.46 | 7.51 | 14.29 | 7.82 | 9.14 | 9.14 | 9.14 | 9.14 | 9.14 |
| Inventories | 30,578.1 | 31,194.7 | 35,728.1 | 59,707.7 | 59,702.6 | 17,344.3 | 20,532.6 | 24,307.1 | 28,775.5 | 34,065.2 |
| Inventories, % | 211.25 | 224.87 | 303.95 | 542.5 | 407.5 | 100 | 100 | 100 | 100 | 100 |
| Accounts Payable | 3,267.6 | 4,281.8 | 4,956.5 | 5,285.7 | 6,067.6 | 6,419.0 | 7,599.0 | 8,995.9 | 10,649.6 | 12,607.4 |
| Accounts Payable, % | 22.57 | 30.87 | 42.17 | 48.03 | 41.41 | 37.01 | 37.01 | 37.01 | 37.01 | 37.01 |
| Capital Expenditure | -4,043.5 | -2,803.8 | -2,191.6 | -3,238.8 | -3,351.9 | -4,131.3 | -4,890.8 | -5,789.8 | -6,854.2 | -8,114.1 |
| Capital Expenditure, % | -27.93 | -20.21 | -18.64 | -29.43 | -22.88 | -23.82 | -23.82 | -23.82 | -23.82 | -23.82 |
| Tax Rate, % | 39.73 | 39.73 | 39.73 | 39.73 | 39.73 | 39.73 | 39.73 | 39.73 | 39.73 | 39.73 |
| EBITAT | 4,493.7 | 4,578.5 | 1,886.5 | 2,123.1 | 2,292.1 | 3,951.3 | 4,677.6 | 5,537.5 | 6,555.5 | 7,760.5 |
| Depreciation | ||||||||||
| Changes in Account Receivables | ||||||||||
| Changes in Inventories | ||||||||||
| Changes in Accounts Payable | ||||||||||
| Capital Expenditure | ||||||||||
| UFCF | -27,583.5 | 1,615.5 | -2,620.7 | -24,432.2 | 1,160.3 | 42,980.6 | -1,458.8 | -1,727.0 | -2,044.5 | -2,420.3 |
| WACC, % | 3.81 | 3.89 | 3.67 | 3.59 | 3.82 | 3.76 | 3.76 | 3.76 | 3.76 | 3.76 |
| PV UFCF | ||||||||||
| SUM PV UFCF | 34,746.4 | |||||||||
| Long Term Growth Rate, % | 3.50 | |||||||||
| Free cash flow (T + 1) | -2,505 | |||||||||
| Terminal Value | -979,974 | |||||||||
| Present Terminal Value | -814,997 | |||||||||
| Enterprise Value | -780,251 | |||||||||
| Net Debt | 50,101 | |||||||||
| Equity Value | -830,351 | |||||||||
| Diluted Shares Outstanding, MM | 4,925 | |||||||||
| Equity Value Per Share | -168.61 |
Benefits You Will Receive
- Customizable Excel Template: A fully adjustable Excel-based DCF Calculator featuring pre-loaded financial data for Shanghai Lujiazui Finance & Trade Zone Development Co., Ltd. (600663SS).
- Accurate Market Data: Access to historical performance metrics and projected estimates (highlighted in the yellow cells).
- Adjustable Forecast Inputs: Modify key assumptions such as revenue growth, EBITDA %, and WACC as needed.
- Real-Time Calculations: Instantly observe how your assumptions influence the valuation of Shanghai Lujiazui Finance & Trade Zone Development Co., Ltd. (600663SS).
- Professional Resource: Designed with the needs of investors, CFOs, consultants, and financial analysts in mind.
- Intuitive Interface: Organized for easy navigation and usability, complete with clear step-by-step instructions.
Key Features
- Comprehensive Historical Data: Access Shanghai Lujiazui Finance & Trade Zone Development Co., Ltd.'s (600663SS) detailed financial statements and pre-filled forecasts.
- Customizable Parameters: Modify WACC, tax rates, revenue growth, and EBITDA margins to suit your analysis.
- Real-Time Valuation: Witness the intrinsic value of Shanghai Lujiazui Finance & Trade Zone Development Co., Ltd. (600663SS) update instantly.
- Intuitive Visualizations: Dashboard charts effectively illustrate valuation findings and critical metrics.
- Designed for Precision: A robust tool tailored for analysts, investors, and finance professionals.
How It Works
- Download: Get the comprehensive Excel file featuring Shanghai Lujiazui Finance & Trade Zone Development Co., Ltd.'s (600663SS) financial data.
- Customize: Modify projections such as revenue growth, EBITDA %, and WACC according to your needs.
- Update Automatically: Watch as intrinsic value and NPV calculations refresh in real-time.
- Test Scenarios: Generate various forecasts and instantly compare their outcomes.
- Make Decisions: Leverage the valuation insights to inform your investment approach.
Why Opt for This Valuation Tool?
- Reliable Insights: Leverage authentic financial data from Shanghai Lujiazui Finance & Trade Zone Development Co., Ltd. (600663SS) for dependable valuation outputs.
- Fully Customizable: Tailor essential inputs such as growth assumptions, discount rates, and tax considerations to align with your financial forecasts.
- Efficiency Boost: Our pre-configured calculations save you time by removing the need for manual setup.
- Expert-Level Solution: Crafted specifically for investors, financial analysts, and industry consultants.
- Easy to Use: Designed with a straightforward interface and clear instructions, making it accessible for all users.
Who Can Benefit from This Product?
- Investors: Accurately assess the fair value of Shanghai Lujiazui Finance & Trade Zone Development Co., Ltd. (600663SS) before making investment choices.
- CFOs: Utilize a professional-grade DCF model for comprehensive financial reporting and analysis.
- Consultants: Effortlessly customize the template for valuation reports tailored to clients.
- Entrepreneurs: Acquire insights into financial modeling techniques employed by leading companies.
- Educators: Implement it as an instructional resource to illustrate valuation approaches.
Contents of the Template
- Preloaded 600663SS Data: Historical and projected financial metrics, including revenue, EBIT, and capital expenditures.
- DCF and WACC Models: Advanced sheets to compute intrinsic value and Weighted Average Cost of Capital.
- Editable Inputs: Yellow-highlighted fields for modifying revenue growth, tax rates, and discount rates.
- Financial Statements: Detailed annual and quarterly financial reports for thorough analysis.
- Key Ratios: Profitability, leverage, and efficiency metrics for performance assessment.
- Dashboard and Charts: Visual representations of valuation results and assumptions.
Disclaimer
All information, articles, and product details provided on this website are for general informational and educational purposes only. We do not claim any ownership over, nor do we intend to infringe upon, any trademarks, copyrights, logos, brand names, or other intellectual property mentioned or depicted on this site. Such intellectual property remains the property of its respective owners, and any references here are made solely for identification or informational purposes, without implying any affiliation, endorsement, or partnership.
We make no representations or warranties, express or implied, regarding the accuracy, completeness, or suitability of any content or products presented. Nothing on this website should be construed as legal, tax, investment, financial, medical, or other professional advice. In addition, no part of this site—including articles or product references—constitutes a solicitation, recommendation, endorsement, advertisement, or offer to buy or sell any securities, franchises, or other financial instruments, particularly in jurisdictions where such activity would be unlawful.
All content is of a general nature and may not address the specific circumstances of any individual or entity. It is not a substitute for professional advice or services. Any actions you take based on the information provided here are strictly at your own risk. You accept full responsibility for any decisions or outcomes arising from your use of this website and agree to release us from any liability in connection with your use of, or reliance upon, the content or products found herein.