
|
Sichuan Chuantou Energy Co., Ltd. (600674.ss) Valoración de DCF |
Completamente Editable: Adáptelo A Sus Necesidades En Excel O Sheets
Diseño Profesional: Plantillas Confiables Y Estándares De La Industria
Predeterminadas Para Un Uso Rápido Y Eficiente
Compatible con MAC / PC, completamente desbloqueado
No Se Necesita Experiencia; Fáciles De Seguir
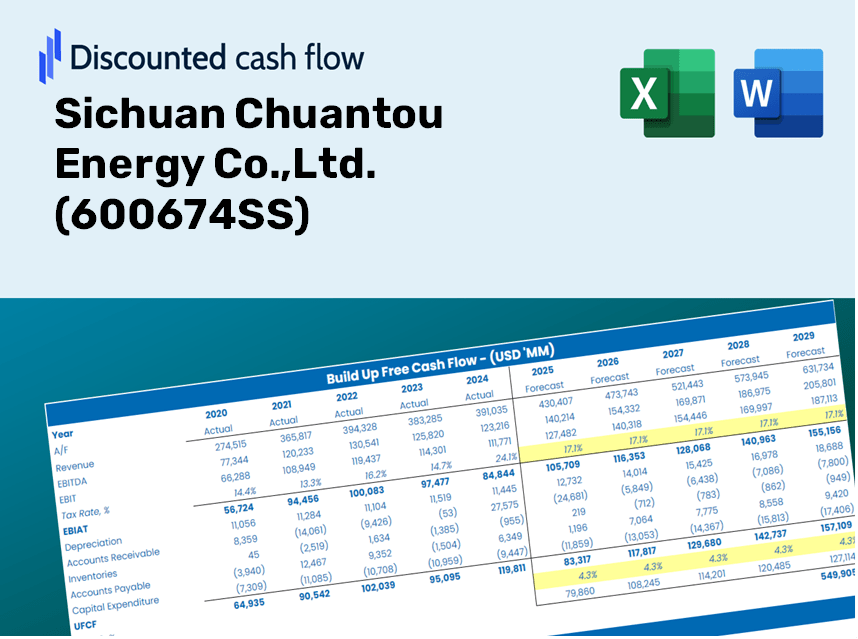
Sichuan Chuantou Energy Co.,Ltd. (600674.SS) Bundle
¡Mejore sus opciones de inversión con la calculadora DCF de Sichuan Chuantou Energy Co., Ltd. (600674SS)! Utilice datos financieros auténticos, ajuste las proyecciones y gastos de crecimiento, y observe instantáneamente cómo estas modificaciones afectan el valor intrínseco de Sichuan Chuantou Energy Co., Ltd. (600674SS).
Discounted Cash Flow (DCF) - (USD MM)
| Year | AY1 2020 |
AY2 2021 |
AY3 2022 |
AY4 2023 |
AY5 2024 |
FY1 2025 |
FY2 2026 |
FY3 2027 |
FY4 2028 |
FY5 2029 |
|---|---|---|---|---|---|---|---|---|---|---|
| Revenue | 1,031.1 | 1,263.3 | 1,420.4 | 1,482.4 | 1,609.0 | 1,801.5 | 2,017.0 | 2,258.3 | 2,528.5 | 2,831.1 |
| Revenue Growth, % | 0 | 22.52 | 12.43 | 4.36 | 8.54 | 11.96 | 11.96 | 11.96 | 11.96 | 11.96 |
| EBITDA | 506.7 | 530.1 | 569.8 | 718.7 | 821.3 | 831.4 | 930.9 | 1,042.2 | 1,166.9 | 1,306.5 |
| EBITDA, % | 49.14 | 41.96 | 40.11 | 48.49 | 51.05 | 46.15 | 46.15 | 46.15 | 46.15 | 46.15 |
| Depreciation | 224.5 | 281.2 | 321.3 | 328.5 | 311.3 | 389.7 | 436.3 | 488.5 | 547.0 | 612.4 |
| Depreciation, % | 21.77 | 22.26 | 22.62 | 22.16 | 19.35 | 21.63 | 21.63 | 21.63 | 21.63 | 21.63 |
| EBIT | 282.2 | 248.9 | 248.5 | 390.2 | 510.0 | 441.7 | 494.5 | 553.7 | 619.9 | 694.1 |
| EBIT, % | 27.37 | 19.7 | 17.5 | 26.32 | 31.7 | 24.52 | 24.52 | 24.52 | 24.52 | 24.52 |
| Total Cash | 3,775.8 | 3,438.5 | 2,988.1 | 2,365.0 | 2,602.8 | 1,801.5 | 2,017.0 | 2,258.3 | 2,528.5 | 2,831.1 |
| Total Cash, percent | .0 | .0 | .0 | .0 | .0 | .0 | .0 | .0 | .0 | .0 |
| Account Receivables | 487.8 | 488.3 | 740.4 | 799.5 | 945.0 | 903.4 | 1,011.5 | 1,132.6 | 1,268.1 | 1,419.8 |
| Account Receivables, % | 47.3 | 38.65 | 52.13 | 53.93 | 58.73 | 50.15 | 50.15 | 50.15 | 50.15 | 50.15 |
| Inventories | 132.6 | 121.2 | 101.1 | 69.4 | 79.2 | 141.1 | 158.0 | 176.9 | 198.1 | 221.8 |
| Inventories, % | 12.86 | 9.6 | 7.12 | 4.68 | 4.92 | 7.83 | 7.83 | 7.83 | 7.83 | 7.83 |
| Accounts Payable | 176.1 | 195.9 | 242.3 | 271.5 | 430.9 | 341.3 | 382.2 | 427.9 | 479.1 | 536.4 |
| Accounts Payable, % | 17.08 | 15.51 | 17.06 | 18.31 | 26.78 | 18.95 | 18.95 | 18.95 | 18.95 | 18.95 |
| Capital Expenditure | -459.9 | -905.5 | -648.5 | -715.2 | -920.4 | -963.4 | -1,078.6 | -1,207.7 | -1,352.2 | -1,513.9 |
| Capital Expenditure, % | -44.6 | -71.67 | -45.66 | -48.25 | -57.2 | -53.48 | -53.48 | -53.48 | -53.48 | -53.48 |
| Tax Rate, % | 4.13 | 4.13 | 4.13 | 4.13 | 4.13 | 4.13 | 4.13 | 4.13 | 4.13 | 4.13 |
| EBITAT | 274.6 | 241.6 | 241.7 | 376.1 | 488.9 | 427.5 | 478.6 | 535.9 | 600.0 | 671.8 |
| Depreciation | ||||||||||
| Changes in Account Receivables | ||||||||||
| Changes in Inventories | ||||||||||
| Changes in Accounts Payable | ||||||||||
| Capital Expenditure | ||||||||||
| UFCF | -405.1 | -352.0 | -271.2 | -8.6 | -116.0 | -256.2 | -247.8 | -277.5 | -310.7 | -347.9 |
| WACC, % | 4.35 | 4.35 | 4.35 | 4.35 | 4.35 | 4.35 | 4.35 | 4.35 | 4.35 | 4.35 |
| PV UFCF | ||||||||||
| SUM PV UFCF | -1,260.5 | |||||||||
| Long Term Growth Rate, % | 2.00 | |||||||||
| Free cash flow (T + 1) | -355 | |||||||||
| Terminal Value | -15,090 | |||||||||
| Present Terminal Value | -12,196 | |||||||||
| Enterprise Value | -13,456 | |||||||||
| Net Debt | 14,886 | |||||||||
| Equity Value | -28,342 | |||||||||
| Diluted Shares Outstanding, MM | 4,850 | |||||||||
| Equity Value Per Share | -5.84 |
What You Will Receive
- Real 600674 Financial Data: Pre-populated with Sichuan Chuantou Energy's historical and projected figures for accurate analysis.
- Fully Customizable Template: Easily adjust essential inputs such as revenue growth, WACC, and EBITDA percentage.
- Instant Calculations: Watch Sichuan Chuantou Energy's intrinsic value update immediately in response to your modifications.
- Professional Valuation Tool: Tailored for investors, analysts, and consultants aiming for precise DCF outcomes.
- User-Friendly Interface: Intuitive layout and clear guidance suitable for all skill levels.
Key Features
- Authentic Historical Data for Sichuan Chuantou Energy: Comes pre-loaded with the company's past financial performance and future growth projections.
- Completely Customizable Parameters: Tailor inputs for revenue growth, profit margins, WACC, tax percentages, and capital expenditures.
- Interactive Valuation Framework: Automatically refreshes Net Present Value (NPV) and intrinsic value calculations based on your adjustments.
- Scenario Analysis: Develop various forecast scenarios to evaluate different valuation results.
- User-Centric Interface: Intuitive, organized, and suitable for both industry professionals and novices.
How It Works
- Step 1: Download the Excel file for Sichuan Chuantou Energy Co., Ltd. (600674SS).
- Step 2: Examine the pre-filled financial data and projections for Sichuan Chuantou Energy Co., Ltd. (600674SS).
- Step 3: Adjust key inputs such as revenue growth, WACC, and tax rates (highlighted cells).
- Step 4: Observe the DCF model update in real-time as you modify your assumptions.
- Step 5: Review the outputs and leverage the findings for your investment strategies.
Why Choose This Calculator for Sichuan Chuantou Energy Co., Ltd. (600674SS)?
- User-Friendly Interface: Perfectly suited for both novice and advanced users.
- Customizable Inputs: Modify parameters effortlessly to match your analysis needs.
- Real-Time Feedback: Observe immediate changes in Sichuan Chuantou Energy’s valuation as you adjust inputs.
- Preloaded Data: Comes with Sichuan Chuantou Energy’s actual financial figures for swift evaluation.
- Highly Regarded: Trusted by financial professionals for making well-informed investment decisions.
Who Should Utilize This Product?
- Investors: Evaluate Sichuan Chuantou Energy Co., Ltd.’s valuation prior to making stock transactions.
- CFOs and Financial Analysts: Optimize valuation workflows and assess financial forecasts.
- Startup Founders: Discover how large public enterprises like Sichuan Chuantou Energy Co., Ltd. are appraised.
- Consultants: Provide comprehensive valuation reports for your clients.
- Students and Educators: Apply actual data for practicing and teaching valuation methods.
Contents of the Template
- Preloaded Energy Data for Sichuan Chuantou Energy (600674SS): Historical and forecasted financial metrics, including revenue, EBIT, and capital expenditures.
- DCF and WACC Models: Professional-grade spreadsheets for determining intrinsic value and Weighted Average Cost of Capital.
- Editable Inputs: Yellow-highlighted cells for modifying revenue growth, tax rates, and discount rates.
- Financial Statements: Detailed annual and quarterly financial records for in-depth analysis.
- Key Ratios: Ratios for profitability, leverage, and efficiency to assess performance.
- Dashboard and Charts: Visual representations of valuation results and underlying assumptions.
Disclaimer
All information, articles, and product details provided on this website are for general informational and educational purposes only. We do not claim any ownership over, nor do we intend to infringe upon, any trademarks, copyrights, logos, brand names, or other intellectual property mentioned or depicted on this site. Such intellectual property remains the property of its respective owners, and any references here are made solely for identification or informational purposes, without implying any affiliation, endorsement, or partnership.
We make no representations or warranties, express or implied, regarding the accuracy, completeness, or suitability of any content or products presented. Nothing on this website should be construed as legal, tax, investment, financial, medical, or other professional advice. In addition, no part of this site—including articles or product references—constitutes a solicitation, recommendation, endorsement, advertisement, or offer to buy or sell any securities, franchises, or other financial instruments, particularly in jurisdictions where such activity would be unlawful.
All content is of a general nature and may not address the specific circumstances of any individual or entity. It is not a substitute for professional advice or services. Any actions you take based on the information provided here are strictly at your own risk. You accept full responsibility for any decisions or outcomes arising from your use of this website and agree to release us from any liability in connection with your use of, or reliance upon, the content or products found herein.