
|
Chengtun Mining Group Co., Ltd. (600711.ss) Valoración de DCF |
Completamente Editable: Adáptelo A Sus Necesidades En Excel O Sheets
Diseño Profesional: Plantillas Confiables Y Estándares De La Industria
Predeterminadas Para Un Uso Rápido Y Eficiente
Compatible con MAC / PC, completamente desbloqueado
No Se Necesita Experiencia; Fáciles De Seguir
Chengtun Mining Group Co., Ltd. (600711.SS) Bundle
¡Explore el futuro financiero de Chengtun Mining Group Co., Ltd. (600711ss) con nuestra calculadora DCF fácil de usar! Ingrese sus proyecciones para el crecimiento, los márgenes y los gastos para calcular el valor intrínseco de Chengtun Mining Group Co., Ltd. (600711ss) y mejorar sus decisiones de inversión.
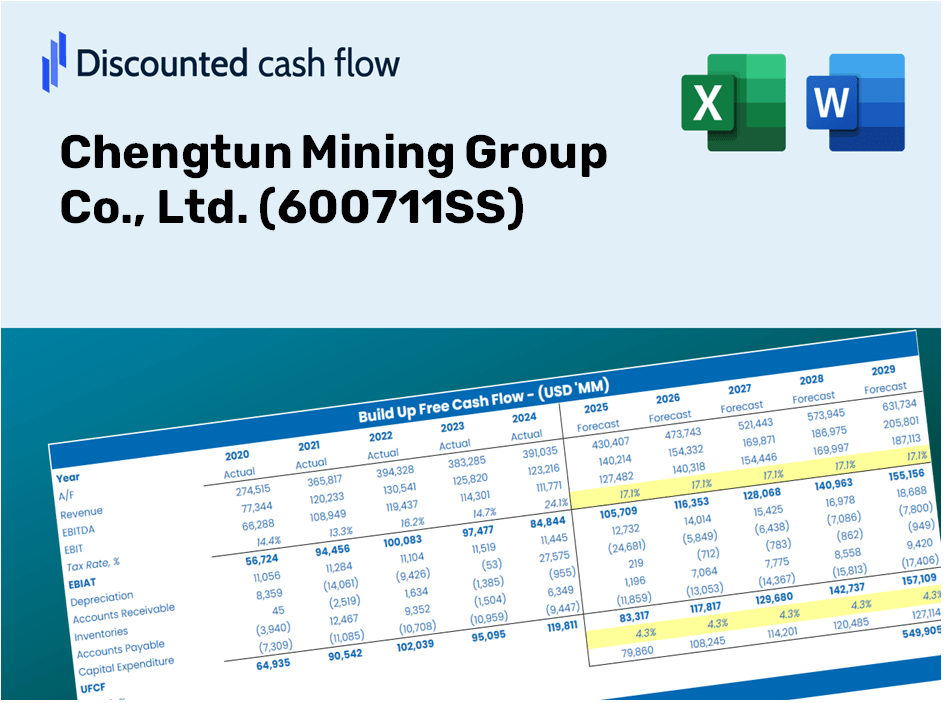
Discounted Cash Flow (DCF) - (USD MM)
| Year | AY1 2020 |
AY2 2021 |
AY3 2022 |
AY4 2023 |
AY5 2024 |
FY1 2025 |
FY2 2026 |
FY3 2027 |
FY4 2028 |
FY5 2029 |
|---|---|---|---|---|---|---|---|---|---|---|
| Revenue | 39,236.2 | 45,239.9 | 25,833.5 | 24,455.8 | 25,730.5 | 23,947.6 | 22,288.3 | 20,743.9 | 19,306.5 | 17,968.8 |
| Revenue Growth, % | 0 | 15.3 | -42.9 | -5.33 | 5.21 | -6.93 | -6.93 | -6.93 | -6.93 | -6.93 |
| EBITDA | 1,229.2 | 3,868.2 | 1,904.1 | 2,211.8 | 4,409.7 | 2,166.6 | 2,016.5 | 1,876.8 | 1,746.7 | 1,625.7 |
| EBITDA, % | 3.13 | 8.55 | 7.37 | 9.04 | 17.14 | 9.05 | 9.05 | 9.05 | 9.05 | 9.05 |
| Depreciation | 373.4 | 519.8 | 537.7 | 1,015.0 | 1,345.3 | 649.5 | 604.5 | 562.6 | 523.6 | 487.3 |
| Depreciation, % | 0.95171 | 1.15 | 2.08 | 4.15 | 5.23 | 2.71 | 2.71 | 2.71 | 2.71 | 2.71 |
| EBIT | 855.8 | 3,348.4 | 1,366.5 | 1,196.8 | 3,064.4 | 1,517.1 | 1,412.0 | 1,314.1 | 1,223.1 | 1,138.3 |
| EBIT, % | 2.18 | 7.4 | 5.29 | 4.89 | 11.91 | 6.34 | 6.34 | 6.34 | 6.34 | 6.34 |
| Total Cash | 2,172.1 | 3,396.5 | 4,828.6 | 5,416.4 | 5,716.9 | 3,644.9 | 3,392.3 | 3,157.3 | 2,938.5 | 2,734.9 |
| Total Cash, percent | .0 | .0 | .0 | .0 | .0 | .0 | .0 | .0 | .0 | .0 |
| Account Receivables | 1,849.8 | 2,190.7 | 1,999.1 | 1,762.2 | 1,356.7 | 1,426.0 | 1,327.2 | 1,235.3 | 1,149.7 | 1,070.0 |
| Account Receivables, % | 4.71 | 4.84 | 7.74 | 7.21 | 5.27 | 5.95 | 5.95 | 5.95 | 5.95 | 5.95 |
| Inventories | 3,478.7 | 5,417.4 | 6,454.2 | 6,798.3 | 7,892.2 | 4,995.2 | 4,649.1 | 4,327.0 | 4,027.2 | 3,748.1 |
| Inventories, % | 8.87 | 11.97 | 24.98 | 27.8 | 30.67 | 20.86 | 20.86 | 20.86 | 20.86 | 20.86 |
| Accounts Payable | 4,018.6 | 4,118.8 | 4,973.5 | 4,908.7 | 3,696.1 | 3,498.0 | 3,255.6 | 3,030.0 | 2,820.1 | 2,624.7 |
| Accounts Payable, % | 10.24 | 9.1 | 19.25 | 20.07 | 14.36 | 14.61 | 14.61 | 14.61 | 14.61 | 14.61 |
| Capital Expenditure | -1,600.1 | -1,566.8 | -2,087.2 | -2,882.3 | -1,589.7 | -1,608.5 | -1,497.1 | -1,393.4 | -1,296.8 | -1,207.0 |
| Capital Expenditure, % | -4.08 | -3.46 | -8.08 | -11.79 | -6.18 | -6.72 | -6.72 | -6.72 | -6.72 | -6.72 |
| Tax Rate, % | 17.31 | 17.31 | 17.31 | 17.31 | 17.31 | 17.31 | 17.31 | 17.31 | 17.31 | 17.31 |
| EBITAT | 445.9 | 1,271.0 | -3.1 | 525.2 | 2,534.0 | 657.3 | 611.8 | 569.4 | 529.9 | 493.2 |
| Depreciation | ||||||||||
| Changes in Account Receivables | ||||||||||
| Changes in Inventories | ||||||||||
| Changes in Accounts Payable | ||||||||||
| Capital Expenditure | ||||||||||
| UFCF | -2,090.6 | -1,955.5 | -1,543.3 | -1,514.0 | 388.6 | 2,327.8 | -78.3 | -72.8 | -67.8 | -63.1 |
| WACC, % | 7.17 | 6.91 | 6.19 | 7.02 | 7.75 | 7.01 | 7.01 | 7.01 | 7.01 | 7.01 |
| PV UFCF | ||||||||||
| SUM PV UFCF | 1,950.9 | |||||||||
| Long Term Growth Rate, % | 3.50 | |||||||||
| Free cash flow (T + 1) | -65 | |||||||||
| Terminal Value | -1,861 | |||||||||
| Present Terminal Value | -1,327 | |||||||||
| Enterprise Value | 624 | |||||||||
| Net Debt | 3,936 | |||||||||
| Equity Value | -3,312 | |||||||||
| Diluted Shares Outstanding, MM | 3,091 | |||||||||
| Equity Value Per Share | -1.07 |
What You Will Receive
- Accurate 600711SS Financial Data: Pre-loaded with Chengtun Mining Group’s historical and projected financial information for detailed analysis.
- Completely Customizable Template: Easily adjust essential inputs such as revenue growth, WACC, and EBITDA percentage.
- Instant Calculations: Watch as Chengtun Mining Group’s intrinsic value updates in real-time with your modifications.
- Professional Valuation Tool: Tailored for investors, analysts, and consultants looking for reliable DCF results.
- Intuitive Design: Clear layout and straightforward guidance suitable for users of all experience levels.
Key Features
- 🔍 Real-Life [Symbol] Financials: Pre-filled historical and projected data for Chengtun Mining Group Co., Ltd.
- ✏️ Fully Customizable Inputs: Modify all essential parameters (yellow cells) such as WACC, growth %, and tax rates.
- 📊 Professional DCF Valuation: Integrated formulas calculate the intrinsic value of [Symbol] using the Discounted Cash Flow method.
- ⚡ Instant Results: View [Symbol]’s valuation immediately after implementing changes.
- Scenario Analysis: Evaluate and compare results for different financial assumptions side-by-side.
How It Functions
- 1. Access the Template: Download and open the Excel file featuring data from Chengtun Mining Group Co., Ltd. (600711SS).
- 2. Adjust Assumptions: Modify essential inputs such as growth rates, WACC, and capital expenditures.
- 3. Immediate Results: The DCF model automatically computes intrinsic value and NPV in real-time.
- 4. Explore Scenarios: Analyze various forecasts to evaluate different valuation results.
- 5. Present with Assurance: Deliver professional valuation insights to enhance your decision-making process.
Why Choose Chengtun Mining Group's Calculator?
- Precision: Reliable financial data from Chengtun Mining ensures high accuracy.
- Adaptability: Tailored for users to easily assess and adjust their inputs as needed.
- Efficiency: Eliminate the complexities of creating a financial model from the ground up.
- Expert Quality: Crafted with the meticulousness and usability expected at the CFO level.
- Intuitive: User-friendly interface designed for everyone, regardless of financial expertise.
Who Can Benefit from This Product?
- Investors: Evaluate the valuation of Chengtun Mining Group Co., Ltd. (600711SS) before making trading decisions.
- CFOs and Financial Analysts: Optimize valuation methodologies and assess financial forecasts.
- Startup Founders: Understand the valuation practices of established firms such as Chengtun Mining Group Co., Ltd. (600711SS).
- Consultants: Provide comprehensive valuation analyses for your clients.
- Students and Educators: Utilize real-life data to explore and teach valuation strategies.
Contents of the Template
- Preloaded Chengtun Mining Data: Historical and projected financial metrics, including revenue, EBIT, and capital expenditures.
- DCF and WACC Models: High-quality sheets designed for calculating intrinsic value and Weighted Average Cost of Capital.
- Editable Inputs: Yellow-highlighted cells for modifying revenue growth, tax rates, and discount rates.
- Financial Statements: Detailed annual and quarterly financial statements for in-depth analysis.
- Key Ratios: Profitability, leverage, and efficiency ratios for performance assessment.
- Dashboard and Charts: Visual representations of valuation results and underlying assumptions.
Disclaimer
All information, articles, and product details provided on this website are for general informational and educational purposes only. We do not claim any ownership over, nor do we intend to infringe upon, any trademarks, copyrights, logos, brand names, or other intellectual property mentioned or depicted on this site. Such intellectual property remains the property of its respective owners, and any references here are made solely for identification or informational purposes, without implying any affiliation, endorsement, or partnership.
We make no representations or warranties, express or implied, regarding the accuracy, completeness, or suitability of any content or products presented. Nothing on this website should be construed as legal, tax, investment, financial, medical, or other professional advice. In addition, no part of this site—including articles or product references—constitutes a solicitation, recommendation, endorsement, advertisement, or offer to buy or sell any securities, franchises, or other financial instruments, particularly in jurisdictions where such activity would be unlawful.
All content is of a general nature and may not address the specific circumstances of any individual or entity. It is not a substitute for professional advice or services. Any actions you take based on the information provided here are strictly at your own risk. You accept full responsibility for any decisions or outcomes arising from your use of this website and agree to release us from any liability in connection with your use of, or reliance upon, the content or products found herein.