
|
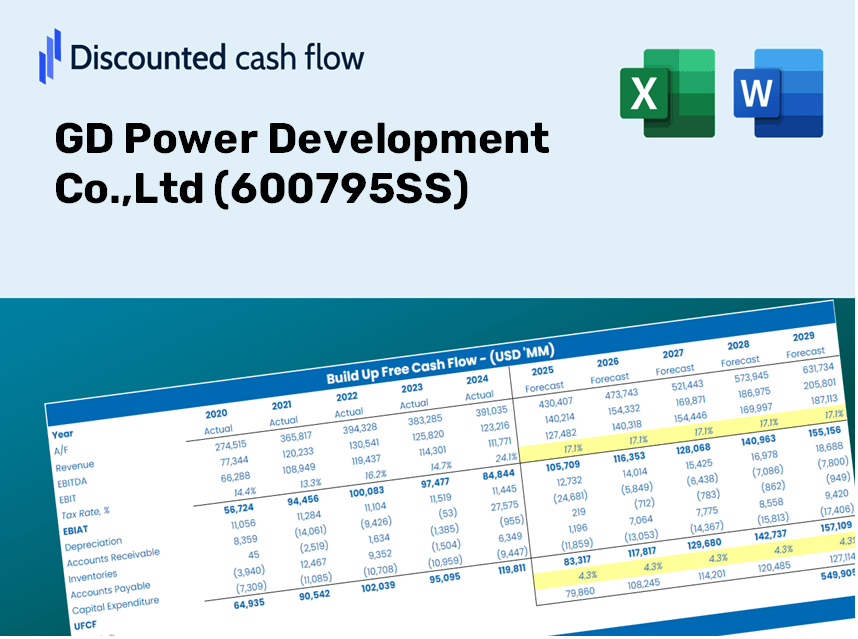
GD Power Development Co., Ltd (600795.SS) Valoración de DCF |
Completamente Editable: Adáptelo A Sus Necesidades En Excel O Sheets
Diseño Profesional: Plantillas Confiables Y Estándares De La Industria
Predeterminadas Para Un Uso Rápido Y Eficiente
Compatible con MAC / PC, completamente desbloqueado
No Se Necesita Experiencia; Fáciles De Seguir
GD Power Development Co.,Ltd (600795.SS) Bundle
¿Busca determinar el valor intrínseco de GD Power Development Co., Ltd? Nuestra calculadora DCF (600795SS) integra datos del mundo real con características de personalización integrales, lo que le permite refinar sus pronósticos y mejorar sus opciones de inversión.
Discounted Cash Flow (DCF) - (USD MM)
| Year | AY1 2020 |
AY2 2021 |
AY3 2022 |
AY4 2023 |
AY5 2024 |
FY1 2025 |
FY2 2026 |
FY3 2027 |
FY4 2028 |
FY5 2029 |
|---|---|---|---|---|---|---|---|---|---|---|
| Revenue | 144,301.5 | 168,433.8 | 194,674.1 | 180,998.9 | 179,182.0 | 173,360.3 | 167,727.7 | 162,278.2 | 157,005.7 | 151,904.5 |
| Revenue Growth, % | 0 | 16.72 | 15.58 | -7.02 | -1 | -3.25 | -3.25 | -3.25 | -3.25 | -3.25 |
| EBITDA | 43,615.3 | 24,891.3 | 39,267.6 | 39,380.2 | 39,201.4 | 37,726.4 | 36,500.7 | 35,314.7 | 34,167.3 | 33,057.2 |
| EBITDA, % | 30.23 | 14.78 | 20.17 | 21.76 | 21.88 | 21.76 | 21.76 | 21.76 | 21.76 | 21.76 |
| Depreciation | 19,179.0 | 17,445.0 | 17,848.8 | 18,211.2 | 18,953.2 | 18,534.2 | 17,932.0 | 17,349.4 | 16,785.7 | 16,240.4 |
| Depreciation, % | 13.29 | 10.36 | 9.17 | 10.06 | 10.58 | 10.69 | 10.69 | 10.69 | 10.69 | 10.69 |
| EBIT | 24,436.3 | 7,446.3 | 21,418.8 | 21,169.0 | 20,248.2 | 19,192.2 | 18,568.6 | 17,965.3 | 17,381.6 | 16,816.9 |
| EBIT, % | 16.93 | 4.42 | 11 | 11.7 | 11.3 | 11.07 | 11.07 | 11.07 | 11.07 | 11.07 |
| Total Cash | 9,427.0 | 11,765.2 | 20,967.7 | 19,165.9 | 15,436.7 | 15,079.8 | 14,589.8 | 14,115.8 | 13,657.2 | 13,213.5 |
| Total Cash, percent | .0 | .0 | .0 | .0 | .0 | .0 | .0 | .0 | .0 | .0 |
| Account Receivables | 20,551.3 | 25,348.1 | 22,304.1 | 23,854.5 | 31,373.2 | 24,768.6 | 23,963.9 | 23,185.3 | 22,432.0 | 21,703.2 |
| Account Receivables, % | 14.24 | 15.05 | 11.46 | 13.18 | 17.51 | 14.29 | 14.29 | 14.29 | 14.29 | 14.29 |
| Inventories | 3,091.8 | 7,254.0 | 6,095.8 | 4,975.7 | 6,148.4 | 5,464.7 | 5,287.1 | 5,115.3 | 4,949.1 | 4,788.3 |
| Inventories, % | 2.14 | 4.31 | 3.13 | 2.75 | 3.43 | 3.15 | 3.15 | 3.15 | 3.15 | 3.15 |
| Accounts Payable | 7,316.6 | 614.3 | 10,084.9 | 25,974.4 | 33,716.7 | 15,180.5 | 14,687.3 | 14,210.1 | 13,748.4 | 13,301.7 |
| Accounts Payable, % | 5.07 | 0.36474 | 5.18 | 14.35 | 18.82 | 8.76 | 8.76 | 8.76 | 8.76 | 8.76 |
| Capital Expenditure | -14,029.0 | -21,399.4 | -37,658.2 | -49,769.3 | -58,095.6 | -35,258.3 | -34,112.7 | -33,004.4 | -31,932.1 | -30,894.6 |
| Capital Expenditure, % | -9.72 | -12.7 | -19.34 | -27.5 | -32.42 | -20.34 | -20.34 | -20.34 | -20.34 | -20.34 |
| Tax Rate, % | 51.92 | 51.92 | 51.92 | 51.92 | 51.92 | 51.92 | 51.92 | 51.92 | 51.92 | 51.92 |
| EBITAT | 7,849.0 | 9,422.8 | 5,927.9 | 7,576.8 | 9,734.8 | 9,353.0 | 9,049.1 | 8,755.1 | 8,470.6 | 8,195.4 |
| Depreciation | ||||||||||
| Changes in Account Receivables | ||||||||||
| Changes in Inventories | ||||||||||
| Changes in Accounts Payable | ||||||||||
| Capital Expenditure | ||||||||||
| UFCF | -3,327.4 | -10,192.9 | -208.7 | -8,522.2 | -30,356.6 | -18,619.1 | -6,642.5 | -6,426.7 | -6,217.9 | -6,015.9 |
| WACC, % | 2.08 | 3.85 | 1.96 | 2.17 | 2.49 | 2.51 | 2.51 | 2.51 | 2.51 | 2.51 |
| PV UFCF | ||||||||||
| SUM PV UFCF | -41,396.5 | |||||||||
| Long Term Growth Rate, % | 0.50 | |||||||||
| Free cash flow (T + 1) | -6,046 | |||||||||
| Terminal Value | -300,878 | |||||||||
| Present Terminal Value | -265,810 | |||||||||
| Enterprise Value | -307,207 | |||||||||
| Net Debt | 227,851 | |||||||||
| Equity Value | -535,058 | |||||||||
| Diluted Shares Outstanding, MM | 17,836 | |||||||||
| Equity Value Per Share | -30.00 |
Your Benefits
- Customizable Excel Template: An adaptable Excel-based DCF Calculator featuring pre-filled financials for GD Power Development Co., Ltd (600795SS).
- Authentic Data: Access to historical performance data and projected estimates (highlighted in the yellow cells).
- Forecast Customization: Adjust key forecast parameters such as revenue growth, EBITDA margin, and WACC.
- Instant Calculations: Quickly observe how your changes affect the valuation of GD Power Development Co., Ltd (600795SS).
- Professional Resource: Designed for investors, CFOs, consultants, and financial analysts.
- Intuitive Layout: Organized for simplicity and ease of navigation, complete with step-by-step guidance.
Key Features
- Customizable Forecast Inputs: Adjust essential metrics such as revenue growth, EBITDA margins, and capital expenditures.
- Instant DCF Valuation: Quickly computes intrinsic value, NPV, and additional metrics.
- High-Precision Outputs: Utilizes GD Power Development Co., Ltd's (600795SS) actual financial data for accurate valuation results.
- Simplified Scenario Analysis: Easily evaluate various assumptions and analyze the resulting impacts.
- Efficiency Booster: Avoid the hassle of constructing intricate valuation models from the ground up.
How It Functions
- Download the Template: Gain immediate access to the Excel-based GD Power DCF Calculator.
- Input Your Assumptions: Modify the yellow-highlighted cells for growth rates, WACC, profit margins, and other variables.
- Instant Calculations: The model automatically recalculates the intrinsic value of GD Power Development Co.,Ltd (600795SS).
- Test Scenarios: Experiment with various assumptions to assess potential changes in valuation.
- Analyze and Decide: Utilize the outcomes to inform your investment strategies or financial evaluations.
Why Opt for This Calculator?
- All-in-One Tool: Integrates DCF, WACC, and financial ratio analyses for a comprehensive evaluation.
- Flexible Inputs: Modify the yellow-highlighted cells to explore different scenarios effortlessly.
- In-Depth Analysis: Automatically computes intrinsic value and Net Present Value for GD Power Development Co., Ltd (600795SS).
- Preloaded Information: Access historical and projected data to ensure accurate initial assessments.
- High-Quality Standards: Perfectly suited for financial analysts, investors, and business advisors.
Who Can Benefit from This Product?
- Institutional Investors: Create in-depth and trustworthy valuation models for evaluating investments in GD Power Development Co., Ltd (600795SS).
- Corporate Strategy Teams: Assess valuation scenarios to inform the company's strategic decisions.
- Financial Consultants: Deliver precise valuation analyses to clients considering GD Power Development Co., Ltd (600795SS) stock.
- Academics and Students: Utilize real-time data to enhance learning and practice in financial modeling.
- Energy Sector Enthusiasts: Gain insights into how energy companies like GD Power Development Co., Ltd (600795SS) are valued within the market.
Contents of the Template
- Operating and Balance Sheet Data: Pre-filled historical data and forecasts for GD Power Development Co., Ltd (600795SS), including revenue, EBITDA, EBIT, and capital expenditures.
- WACC Calculation: A dedicated sheet for the Weighted Average Cost of Capital (WACC), featuring parameters such as Beta, risk-free rate, and share price.
- DCF Valuation (Unlevered and Levered): Customizable Discounted Cash Flow models that present intrinsic value alongside detailed calculations.
- Financial Statements: Pre-loaded annual and quarterly financial statements to facilitate thorough analysis.
- Key Ratios: Includes important profitability, leverage, and efficiency ratios for GD Power Development Co., Ltd (600795SS).
- Dashboard and Charts: A visual summary of valuation outputs and assumptions, designed for straightforward analysis of results.
Disclaimer
All information, articles, and product details provided on this website are for general informational and educational purposes only. We do not claim any ownership over, nor do we intend to infringe upon, any trademarks, copyrights, logos, brand names, or other intellectual property mentioned or depicted on this site. Such intellectual property remains the property of its respective owners, and any references here are made solely for identification or informational purposes, without implying any affiliation, endorsement, or partnership.
We make no representations or warranties, express or implied, regarding the accuracy, completeness, or suitability of any content or products presented. Nothing on this website should be construed as legal, tax, investment, financial, medical, or other professional advice. In addition, no part of this site—including articles or product references—constitutes a solicitation, recommendation, endorsement, advertisement, or offer to buy or sell any securities, franchises, or other financial instruments, particularly in jurisdictions where such activity would be unlawful.
All content is of a general nature and may not address the specific circumstances of any individual or entity. It is not a substitute for professional advice or services. Any actions you take based on the information provided here are strictly at your own risk. You accept full responsibility for any decisions or outcomes arising from your use of this website and agree to release us from any liability in connection with your use of, or reliance upon, the content or products found herein.